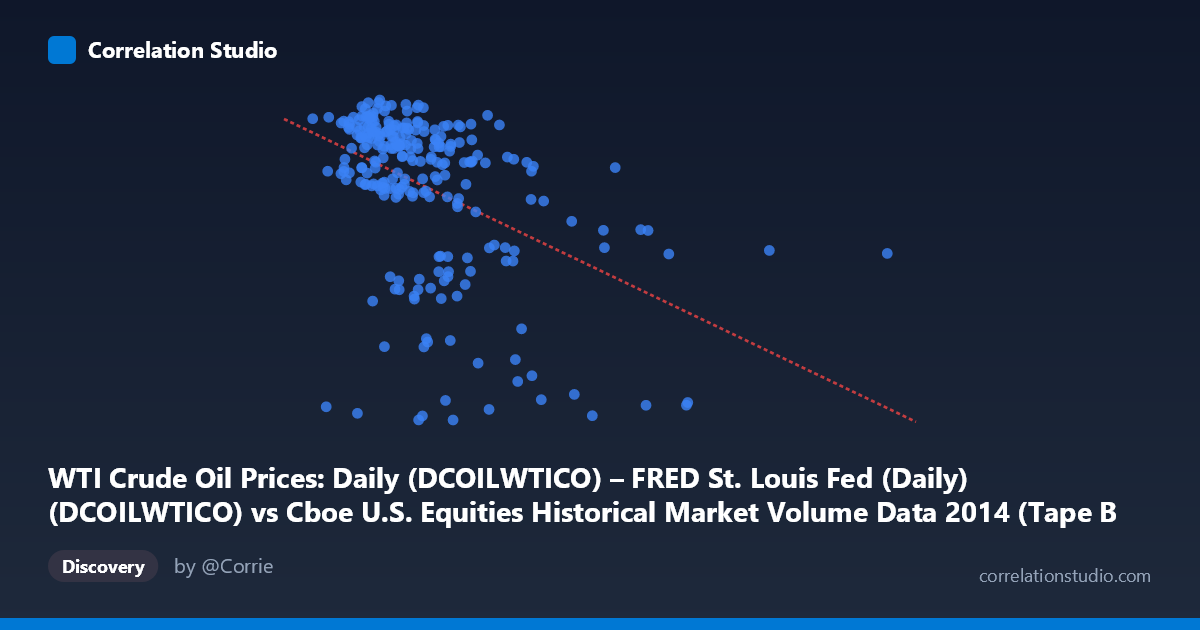
WTI Crude Oil Prices: Daily (DCOILWTICO) – FRED St. Louis Fed (Daily) (DCOILWTICO) vs Cboe U.S. Equities Historical Market Volume Data 2014 (Tape B Trade Count)
- Pearson correlation (r)
- -0.4546
- Spearman correlation
- -0.4729
- p-value
- 0
- Sample size (n)
- 252
- 95% confidence interval
- -0.5474 to -0.3507
- Granger causality
- None
- Granger optimal lag
- 2
AI analysis
Scatterplot Analysis: WTI Crude Oil Prices vs. Cboe Tape B Trade Count (2014)
Relationship Overview
The scatterplot reveals a moderate negative relationship between WTI crude oil prices (X-axis) and Cboe Tape B trade counts (Y-axis) across 252 trading days in 2014. The linear regression equation (y = −8.295×10⁻⁵x + 111.54) indicates that as oil prices rise, trade counts tend to decline, and vice versa. Visually, this manifests as a downward-sloping cloud of points, though with considerable scatter throughout. The relationship is not tight or deterministic — rather, it reflects a broad tendency punctuated by notable exceptions, suggesting that oil price is one of several forces shaping equity market activity on the Cboe's Tape B venues.
Correlation Strength, Direction, and Statistical Significance
The Pearson correlation of r = −0.4546 indicates a moderate negative association. More precisely, r² = 0.2067, meaning that WTI crude oil prices statistically explain only about 20.7% of the variance in Tape B trade counts — leaving nearly 80% of variation attributable to other factors entirely. The 95% confidence interval of [−0.5474, −0.3507] is meaningfully far from zero and does not straddle it, reinforcing that the negative direction is reliable. The p-value of 2.953×10⁻¹⁴ is extraordinarily small, confirming high statistical significance given the sample of 252 paired observations drawn from a population of 3,686 records. However, statistical significance here is partly a function of sample size — it tells us the relationship is real but not strong. Critically, Granger causality tests show no significant temporal predictive direction in either direction (X→Y: F=1.17, p=0.312; Y→X: F=0.51, p=0.602), meaning that past oil prices do not reliably predict future trade counts, nor vice versa. This rules out a straightforward lagged causal mechanism and suggests the observed correlation may be driven by shared contemporaneous influences rather than one variable leading the other.
Notable Patterns, Clusters, and Outliers
Several structural features stand out in the data. There appear to be two distinct horizontal bands in the Y-axis distribution: a dense upper cluster roughly between ~90–108 units (the majority of observations), and a sparse lower cluster around ~53–66 units — suggesting that trade counts do not vary continuously but may cluster around distinct trading regimes or market structure states (e.g., high-activity vs. low-activity days, possibly related to holidays, options expiration, or venue-specific events). On the X-axis, the bulk of observations concentrate in the ~110,000–350,000 range, with a long right tail extending toward ~675,000 — indicating oil price has a right-skewed distribution that year, consistent with the sharp crude oil selloff in the second half of 2014. Notable outliers include points at very high X values (450,000) paired with very low Y values (~55–82), which anchor the negative slope but may be disproportionately influential on the regression. The point near (675,898, ~53) in the far right is a potential high-leverage outlier deserving scrutiny.
Confounding Factors and Caveats
Several important caveats apply. First, 2014 was a highly unusual year for crude oil: prices were relatively stable in the first half (~$100/barrel) before collapsing nearly 50% in Q4, driven by OPEC's decision not to cut production. This structural break could create a spurious or period-specific correlation that does not generalize to other years. Second, Tape B trade count reflects activity on a specific subset of U.S. equity exchanges, not the whole market — broader market volatility events in late 2014 (oil crash, geopolitical tensions, USD strengthening) may have simultaneously depressed oil prices and altered trading behavior, creating an apparent correlation driven by a third variable (macro uncertainty or risk-off sentiment). Third, the two apparent horizontal bands in trade count suggest a possible data quality issue or categorical distinction (e.g., half-days, venue outages, or data encoding artifacts) that could distort the correlation estimate. Finally, because the axes are labeled in a way that appears swapped from the dataset descriptions (oil prices are on X, trade count on Y, yet the dataset metadata attributes these inversely), care should be taken to verify variable alignment before drawing conclusions.
Actionable Insights and Further Investigation
Despite the lack of Granger causality, the contemporaneous negative correlation is robust enough to warrant further investigation. Analysts should segment the data by half-year to test whether the correlation is entirely driven by the Q4 2014 oil crash, or whether a weaker version persists in calmer periods. It would be valuable to include additional covariates — such as the VIX (equity volatility index), USD index, and broader market volume — to determine whether the oil–trade count relationship survives multivariate controls. The bimodal distribution of trade counts should be investigated directly: identifying what distinguishes low-count days from high-count days may reveal a more important driver than oil prices altogether. Finally, extending the analysis across multiple years and applying regime-switching or non-linear models (e.g., piecewise regression around the oil price collapse threshold) could yield a more nuanced and actionable understanding of when, and under what conditions, energy market dynamics meaningfully influence equity market microstructure.
X dataset: Cboe U.S. Equities Historical Market Volume Data 2014
Y dataset: WTI Crude Oil Prices: Daily (DCOILWTICO) – FRED St. Louis Fed (Daily)
Part of experiment: Daily - Cboe U.S. Equities Historical Market Volume Data 2014 vs WTI Crude Oil Prices: Daily (DCOILWTICO) – FRED St. Louis Fed (Daily)