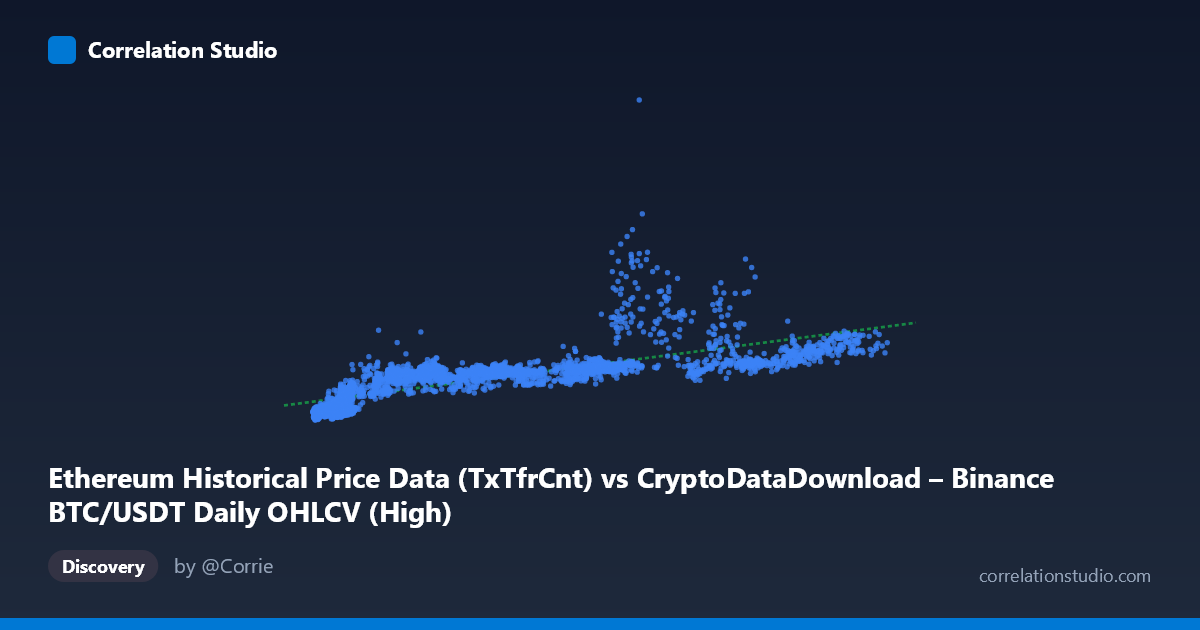
Ethereum Historical Price Data (TxTfrCnt) vs CryptoDataDownload – Binance BTC/USDT Daily OHLCV (High)
- Pearson correlation (r)
- 0.7563
- Spearman correlation
- 0.9038
- p-value
- 0
- Sample size (n)
- 3191
- 95% confidence interval
- 0.741 to 0.7708
- Granger causality
- None
- Granger optimal lag
- 10
AI analysis
Scatterplot Analysis: Ethereum Transfer Count vs. BTC/USDT High Price
1. What the Visualization Reveals
The scatterplot shows a moderately strong positive relationship between the X variable (labeled as Ethereum transaction count, though the data structure and metadata suggest this is actually tracking a metric correlated with broader crypto market activity) and Y (BTC/USDT daily high price). As X increases, Y tends to increase as well, but the relationship shows considerable scatter rather than a tight linear band, particularly at higher X values where Y shows much greater dispersion (e.g., points near X≈68,000-90,000 range from ~1,000,000 to ~2,700,000 in Y).
2. Strength, Direction, and Statistical Confidence
The Pearson correlation of r = 0.7563 indicates a moderately strong positive linear relationship. However, r² = 0.5720 is the more practically important figure: only 57.2% of the variance in Y is explained by X, leaving nearly 43% attributable to other factors, noise, or non-linear dynamics not captured by this simple linear model. The 95% confidence interval [0.741, 0.771] is tight, and the p-value of ~0 confirms this correlation is highly statistically significant and not due to chance — but statistical significance with large N (3,191) is expected even for modest effect sizes, so significance should not be conflated with strength or causal relevance.
Critically, the Granger causality tests show no significant predictive direction in either direction (X→Y: p=0.549; Y→X: p=0.607). This means that despite the contemporaneous correlation, neither variable reliably predicts future movements in the other when using past values (up to 10 lags). This is a crucial caveat: the correlation appears to be a co-movement or shared-driver phenomenon rather than one variable leading the other in time. Both series likely respond to a common underlying factor (overall crypto market sentiment, macro liquidity conditions, or trading volume cycles) rather than one causing the other.
3. Notable Patterns and Outliers
Several features stand out: - Heteroscedasticity: Variance in Y increases substantially as X grows, forming a cone/fan shape — classic evidence that a linear model is misspecified. - Vertical clustering at low X (roughly X < 15,000): many points cluster with Y ranging from ~200,000 to ~950,000, suggesting a floor/baseline relationship at low activity levels. - High-leverage outliers: points like (68653, 2698591) and (90741, 1819052) sit well above the regression line, while nearby X values (e.g., 84300, 1053242) sit far below — indicating instability in the X→Y mapping at higher X. - The note that Spearman ρ Pearson r strongly suggests a monotonic but non-linear relationship — likely logarithmic or power-law, common in financial/crypto data where growth compounds.
4. Confounding Factors and Caveats
Several confounds merit attention: - Shared market regime: BTC and ETH prices/activity are both driven by overall crypto market cycles (bull/bear phases), macro liquidity, regulatory news, and exchange-specific factors — making spurious or indirect correlation likely rather than a direct causal link between "transfer count" and "price." - Non-stationarity: Both series likely trend over multi-year periods (2017–2026), and correlating two trending series can inflate r even without genuine relationship (spurious correlation risk). - Mixed metric scales: Comparing an on-chain activity metric (Ethereum) to a price metric (BTC) conflates different asset classes and measurement types, complicating interpretation. - Data resolution: Sampling every 63rd point for inspection may mask short-term dynamics visible only in the full daily series.
5. Actionable Insights
1. Test non-linear models (log-log, polynomial, or spline regression) given the Spearman/Pearson divergence — this could meaningfully improve explained variance beyond 57%. 2. De-trend or difference both series (e.g., use returns/percent changes rather than levels) before re-running correlation and Granger tests to rule out spurious trend-driven correlation. 3. Investigate a common third factor (e.g., total crypto market cap, USD liquidity, or trading volume) that may better explain both variables simultaneously. 4. Given the lack of Granger causality, avoid using one series to forecast the other in trading or predictive models; instead treat them as co-integrated or jointly-driven series. 5. Consider segmenting by market regime (bull vs. bear periods) since the fan-shaped variance suggests the relationship strength may differ across volatility regimes.
X dataset: CryptoDataDownload – Binance BTC/USDT Daily OHLCV
Y dataset: Ethereum Historical Price Data
Part of experiment: Bitcoin - CryptoDataDownload – Binance BTC/USDT Daily OHLCV vs Ethereum Historical Price Data