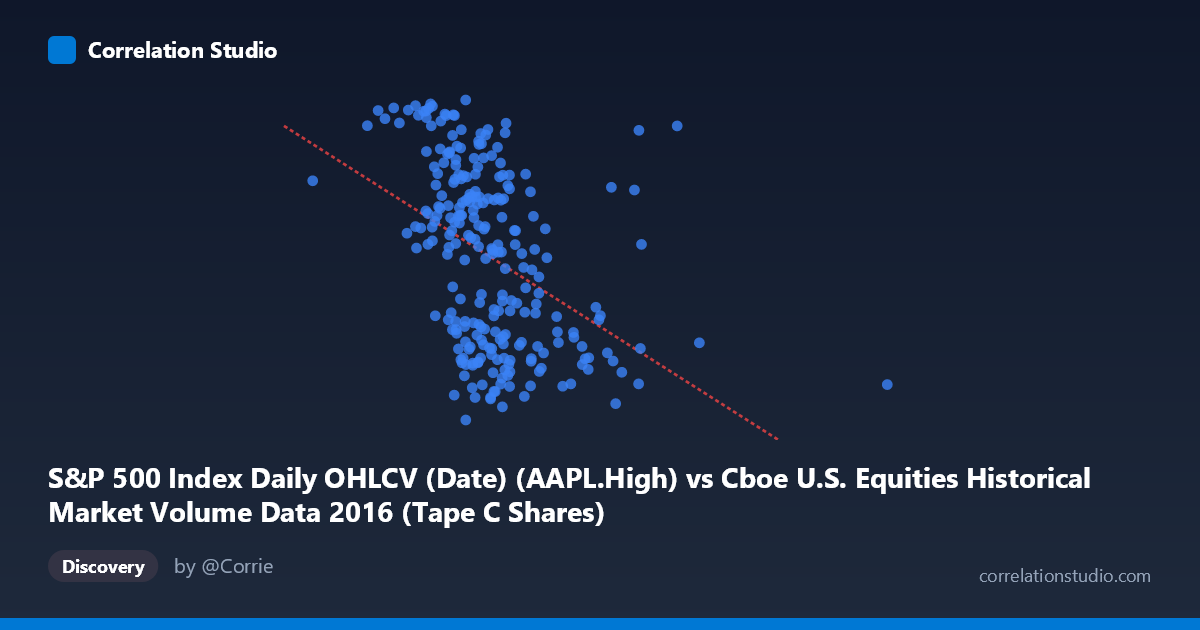
S&P 500 Index Daily OHLCV (Date) (AAPL.High) vs Cboe U.S. Equities Historical Market Volume Data 2016 (Tape C Shares)
- Pearson correlation (r)
- -0.4205
- Spearman correlation
- -0.4822
- p-value
- 0
- Sample size (n)
- 252
- 95% confidence interval
- -0.5172 to -0.3133
- Granger causality
- None
- Granger optimal lag
- 1
- Time coverage
- 2016-01-04 to 2016-12-30
AI analysis
Scatterplot Analysis: AAPL High Price vs. Cboe Tape C Share Volume (2016)
Relationship Overview The scatterplot reveals a moderate negative relationship between Apple's daily high price (X-axis) and Cboe Tape C share volume (Y-axis) across 252 trading days in 2016. The linear regression equation (y = -1.1665×10⁻⁷x + 120.937) indicates that as AAPL's daily high price increases, Tape C share volume tends to decrease. This inverse pattern is visually apparent in the downward-sloping trend, though the data points exhibit considerable scatter around the regression line, signaling that this relationship is real but far from deterministic. The price range spans roughly $51M–$315M in high values, while volume fluctuates between approximately 91.67 and 118.69 (million shares), suggesting meaningful day-to-day variability in both dimensions throughout the year.
Correlation Strength and Statistical Significance The Pearson correlation of r = -0.4205 reflects a moderate negative association, but the more practically meaningful figure is r² = 0.1769 — meaning AAPL's high price explains only ~17.7% of the variance in Tape C share volume. Roughly 82% of volume variation is driven by other factors entirely. The 95% confidence interval of [-0.5172, -0.3133] is entirely negative and does not cross zero, providing strong evidence that the negative direction is genuine rather than a sampling artifact. The p-value of 3.2×10⁻¹² confirms this is highly statistically significant, making random chance an implausible explanation. However, statistical significance here should not be conflated with practical importance — the effect size is modest, and the relationship is noisy enough that knowing AAPL's price offers limited predictive power over daily volume alone.
Patterns, Clusters, and Outliers The sample points reveal several notable features. There is a loose central cluster concentrated around AAPL highs of ~$110M–$145M with Tape C volumes between ~96 and ~116, which aligns with the bulk of 2016 trading activity. However, the scatter is wide throughout — at similar price levels (e.g., ~$120M–$130M), volumes range from ~92 to ~118, illustrating substantial conditional variance. A few potential outliers are visible at the lower end of volume (e.g., ~91.67 at ~$121M) and at lower price extremes (~$94.5M with ~107.44 volume and ~$99.8M with ~117.40), which may reflect unusual market days such as post-earnings sessions, macro announcements, or holiday-adjacent low-liquidity periods. The relationship also appears to be heteroscedastic — variance in Y seems larger at lower X values and may compress slightly at higher AAPL prices — which could mildly violate linear regression assumptions.
Confounding Factors and Caveats Several important caveats apply to interpreting this correlation. First, the axis labels appear cross-referenced between the two datasets (AAPL High is sourced from Cboe data, and Tape C Shares from the S&P 500 dataset), which raises the possibility of a data labeling or joining artifact that could distort the relationship. Second, both variables are time-series measurements for 2016, meaning temporal autocorrelation is likely present — standard Pearson correlation assumes independent observations, which daily financial data rarely satisfies. Third, macroeconomic and market-wide events in 2016 (Brexit, the U.S. presidential election, Federal Reserve rate decisions) created regime shifts in both prices and volumes that could produce spurious correlations. Critically, the Granger causality tests show no significant directional predictive relationship in either direction (X→Y: F=1.31, p=0.25; Y→X: F=0.69, p=0.41), meaning that neither variable's past values help forecast the other — the observed correlation does not reflect a lagged predictive mechanism.
Actionable Insights and Further Investigation Given the modest explanatory power and absence of Granger causality, practitioners should avoid using AAPL price levels alone as a predictor of Tape C volume. Instead, several avenues merit further investigation: (1) Incorporate additional lags beyond 1 period in the Granger analysis to test for longer-horizon predictive effects; (2) Segment the data by market regime (e.g., pre/post-election, high/low VIX periods) to test whether the negative correlation is concentrated in specific conditions; (3) Introduce control variables such as overall market volume (SPY flows), VIX levels, or sector rotation indicators to better isolate the AAPL–Tape C relationship; (4) Test nonlinear models (e.g., polynomial or spline regression) given the visual heteroscedasticity; and (5) Verify the dataset join logic, as the cross-dataset column sourcing noted in the axis labels warrants careful data validation before drawing operational conclusions.
X dataset: Cboe U.S. Equities Historical Market Volume Data 2016
Y dataset: S&P 500 Index Daily OHLCV (Date)
Part of experiment: Daily - Cboe U.S. Equities Historical Market Volume Data 2016 vs S&P 500 Index Daily OHLCV (Date)