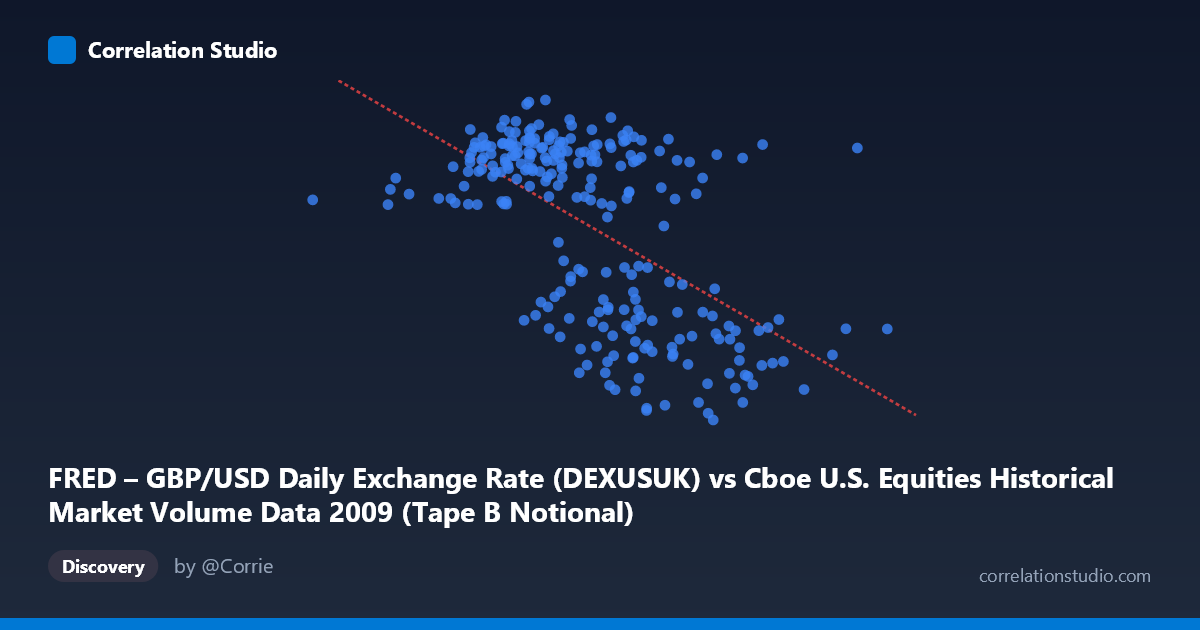
FRED – GBP/USD Daily Exchange Rate (DEXUSUK) vs Cboe U.S. Equities Historical Market Volume Data 2009 (Tape B Notional)
- Pearson correlation (r)
- -0.5848
- Spearman correlation
- -0.5371
- p-value
- 0
- Sample size (n)
- 250
- 95% confidence interval
- -0.6609 to -0.4968
- Granger causality
- None
- Granger optimal lag
- 1
AI analysis
Analysis: GBP/USD Exchange Rate vs. Cboe Tape B Notional Volume (2009)
Relationship Overview The scatterplot reveals a moderate negative relationship between Cboe Tape B notional trading volume (X-axis) and the GBP/USD exchange rate (Y-axis) across 2009 trading days. As equity market notional volume increases, the pound sterling tends to weaken relative to the US dollar. The linear regression equation (y = -4.215×10⁻¹¹x + 1.789) confirms this inverse trajectory, with the slope being extraordinarily small in absolute terms due to the massive scale of notional volume figures (billions of dollars). Visually, the data points likely show a discernible downward trend, though with considerable scatter around the regression line, consistent with a relationship that is real but far from deterministic.
Correlation Strength and Statistical Significance The Pearson correlation of r = -0.585 indicates a moderate negative association, and the R² of 0.342 means that approximately 34.2% of the variance in GBP/USD rates is statistically explained by variation in Tape B notional volume — a non-trivial but clearly incomplete picture, leaving roughly 66% of exchange rate variance unexplained by this variable alone. The 95% confidence interval of [-0.661, -0.497] is entirely negative and does not cross zero, and the p-value of effectively zero (given N = 3,232) confirms this correlation is highly statistically significant and extremely unlikely to be a chance finding. However, statistical significance at this sample size should not be conflated with practical or causal significance. Critically, Granger causality tests reveal no significant predictive directionality in either direction (X→Y: F = 0.333, p = 0.565; Y→X: F = 1.440, p = 0.231), meaning that neither variable meaningfully predicts the other's future values at a one-period lag. This strongly suggests the correlation, while genuine, reflects co-movement rather than a causal mechanism.
Notable Patterns and Outliers Several features warrant attention in the sample points provided. The X-axis range spans roughly 1.3 billion to 9.5 billion in notional value — a nearly 7-fold difference — suggesting high volatility in trading activity throughout 2009, consistent with post-financial-crisis market turbulence. The Y-axis (GBP/USD) is relatively compressed between 1.37 and 1.70, reflecting a period of notable sterling weakness following the 2008 crisis. The lower end of the exchange rate (values near 1.37–1.44) tends to cluster with higher notional volumes (above ~6.5 billion), while higher GBP/USD values (1.62–1.70) more frequently appear at moderate volume levels (3–5.5 billion). At least one notable outlier exists at the minimum X value (1,320,771,983, GBP/USD = 1.59), which may represent an anomalously low-volume trading day (holiday-adjacent or early January). The point at approximately (8.73B, 1.43) also stands out as a high-volume, low-rate observation reinforcing the negative trend.
Confounding Factors and Interpretive Caveats This correlation almost certainly reflects shared sensitivity to a common underlying driver rather than a direct causal link. The year 2009 was dominated by the global financial crisis recovery, and both US equity market activity and currency valuations were simultaneously influenced by macro forces including Federal Reserve policy, risk appetite shifts, credit market conditions, and global capital flows. During risk-off episodes, investors historically fled to USD (depressing GBP/USD) while also generating elevated equity market volumes through panic selling or deleveraging — this alone could mechanically produce the observed negative correlation. Additionally, the axes appear to be swapped in the dataset description (X is labeled as GBP/USD from FRED, but the column assignment in the visualization places notional volume on X and exchange rate on Y), which is a metadata inconsistency worth resolving before drawing firm conclusions. The Granger causality null result further cautions against any mechanistic interpretation.
Actionable Insights and Further Investigation Given the moderate correlation without causal directionality, this relationship is most useful as a macro-regime indicator rather than a trading signal. Practitioners should consider: (1) controlling for the VIX or credit spreads as proxies for risk appetite, which likely confound both series simultaneously; (2) segmenting the data by market phase (e.g., Q1 crisis lows vs. H2 recovery) to test whether the correlation is stable or concentrated in specific stress periods; (3) extending the Granger analysis to multiple lags beyond the single period tested, as currency-equity relationships can operate on weekly rather than daily timescales; and (4) comparing 2009 against adjacent years to determine whether this correlation is specific to crisis conditions or a persistent structural feature of these markets. A multivariate regression incorporating volatility measures would likely substantially increase the explained variance beyond the current 34.2%.
X dataset: Cboe U.S. Equities Historical Market Volume Data 2009
Y dataset: FRED – GBP/USD Daily Exchange Rate
Part of experiment: Daily - Cboe U.S. Equities Historical Market Volume Data 2009 vs FRED – GBP/USD Daily Exchange Rate