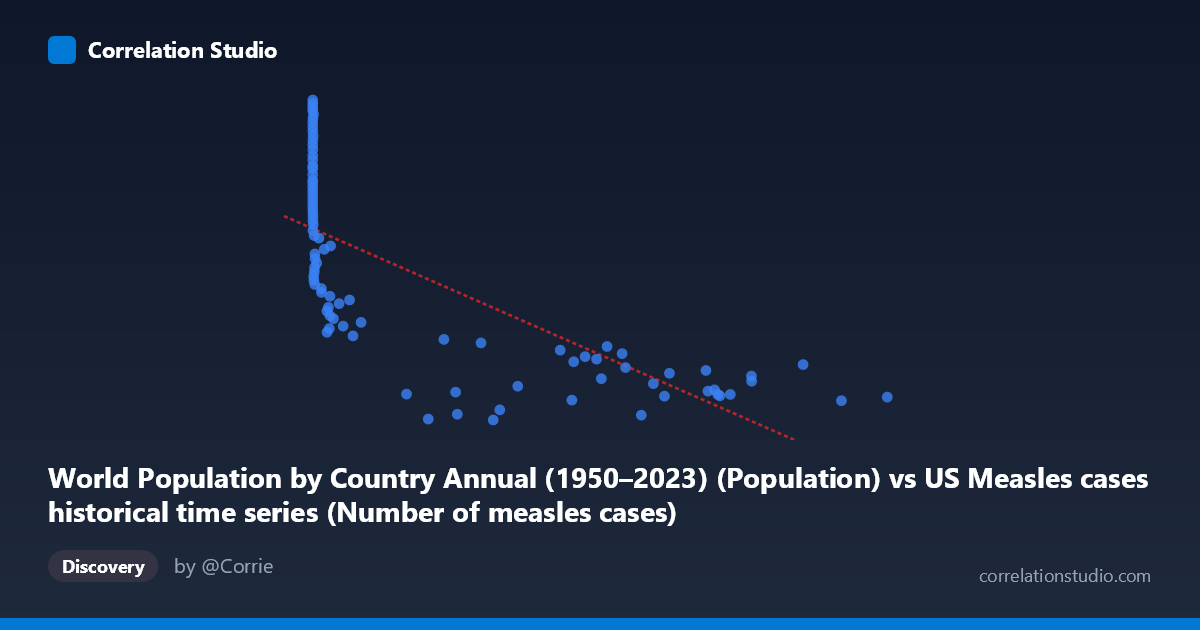
World Population by Country Annual (1950–2023) (Population) vs US Measles cases historical time series (Number of measles cases)
- Pearson correlation (r)
- -0.7345
- Spearman correlation
- -0.9103
- p-value
- 0
- Sample size (n)
- 90
- 95% confidence interval
- -0.8173 to -0.6221
- Granger causality
- None
- Granger optimal lag
- 10
- Time coverage
- 1919-01-01 to 2023-01-01
- Recomputed on refreshed data
- 2026-10-18 (r was -0.7345)
AI analysis
Analysis: World Population vs. US Measles Cases
1. Overall Relationship
The scatterplot reveals a negative relationship between world population size and US measles case counts, meaning that as global population has grown over time (1919–2023), recorded US measles cases have generally declined. The linear regression equation (y = -110.781x + 1.127×10⁸) captures this downward trend, but the data cloud shows considerable spread, particularly at lower population values (smaller X), where measles case counts vary enormously — ranging from near zero to over 160 million reported cases. This wide vertical scatter at the left end of the X-axis is a visually dominant feature and immediately signals that the relationship is more complex than a simple linear one.
2. Correlation Strength, Direction, and Causal Framing
The Pearson correlation of r = -0.7345 indicates a moderately strong negative association, and with R² = 0.5395, approximately 54% of the variance in measles cases is statistically explained by world population size as the predictor variable — leaving roughly 46% unexplained by this model alone. The 95% confidence interval of [-0.8173, -0.6221] is entirely negative and reasonably narrow, confirming that the inverse direction of the relationship is robust and not a sampling artifact. The p-value of 2.22×10⁻¹⁶ is essentially zero, making this correlation statistically significant beyond any reasonable threshold. However, the Granger causality analysis tells a critical story: neither direction (X→Y nor Y→X) achieves significance (F = 1.31, p = 0.247 and F = 0.83, p = 0.601 respectively), meaning that world population does not temporally predict future measles cases, nor vice versa. This effectively rules out any direct predictive or causal mechanism between these two specific variables.
3. Notable Patterns, Clusters, and Outliers
Several structural features are visible in the data. There is a dense cluster of high-Y, low-X points corresponding to early decades (pre-vaccination era, roughly 1919–1960s), where populations were smaller and measles cases were extremely high and highly variable. Notable outliers include points exceeding 150–163 million cases at very low population values (X < 500), likely representing epidemic peak years in the pre-vaccine era. Conversely, the right side of the plot (large X, representing recent decades with high global population) shows measles cases compressed into a relatively narrow, low band — consistent with the near-elimination of measles in the US following the 1963 vaccine introduction. The hint from the Spearman ρ exceeding Pearson r strongly suggests a non-linear (likely logarithmic or power) relationship fits the data better, which is visually consistent with the steep initial decline in cases followed by a flattening plateau at near-zero levels.
4. Confounding Factors and Interpretive Caveats
The most significant caveat here is that both variables are proxies for time. World population grows monotonically year over year, while US measles cases dropped sharply following the 1963 measles vaccine introduction — a discrete historical intervention entirely unrelated to population growth per se. This creates a classic spurious correlation driven by shared temporal trends: any variable that increased steadily from 1919 to 2023 would show a similar negative correlation with measles cases. Additional confounders include changes in surveillance and reporting standards (early case counts may be underestimates), herd immunity thresholds, public health infrastructure, vaccination policy changes (e.g., two-dose MMR recommendations in 1989), and importation dynamics from regions with different vaccination rates. The population variable used is also world population rather than US population, further weakening any mechanistic interpretation.
5. Actionable Insights and Further Investigation
Given that the relationship appears to be a time-confounded spurious correlation, the most productive next steps would include: (1) replacing world population with time (year) as the explicit independent variable to directly model the temporal trend in measles incidence; (2) fitting a logarithmic or piecewise regression model (pre- and post-1963) to better capture the structural break introduced by vaccination; (3) incorporating US vaccination coverage rates as a more mechanistically meaningful predictor; and (4) examining residuals from the temporal trend to identify years with anomalous outbreaks (e.g., 1989–1991 resurgence, 2019 outbreak) that may reveal true predictive signals. The Granger causality null result appropriately closes the door on using population trends as a forecasting tool for measles burden — future modeling should center on immunization coverage, vaccine hesitancy indices, and imported case rates as actionable drivers.
X dataset: US Measles cases historical time series
Y dataset: World Population by Country Annual (1950–2023)
Part of experiment: Yearly - US Measles cases historical time series vs World Population by Country Annual (1950–2023)