Ethereum Historical Data (Daily) (IssTotNtv) vs CryptoDataDownload – Binance BTC/USDT Daily OHLCV (Open)
- Pearson correlation (r)
- -0.6402
- Spearman correlation
- -0.4721
- p-value
- 0
- Sample size (n)
- 3191
- 95% confidence interval
- -0.6602 to -0.6192
- Granger causality
- Y → X
- Granger optimal lag
- 10
- Time coverage
- 2017-08-17 to 2026-05-20
AI analysis
Analysis of the X–Y Relationship
1. Overview of the Visualization
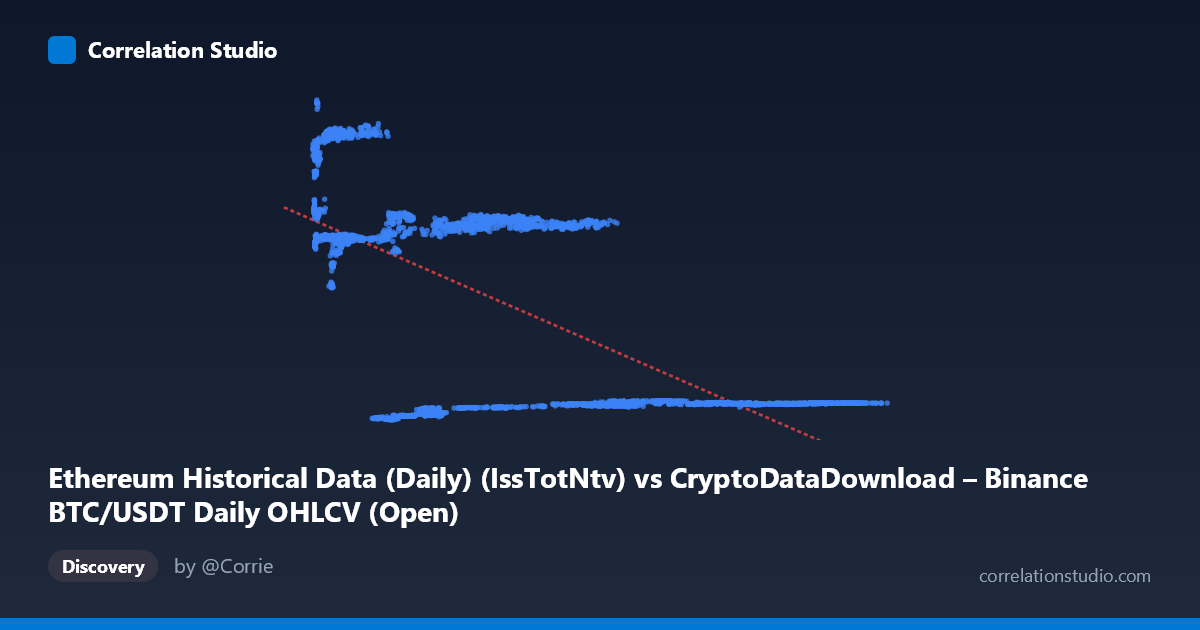
The scatterplot reveals a moderate-to-strong negative relationship between the two variables, with data clustering into several distinct horizontal bands rather than forming a smooth continuous cloud. This banding pattern (visible in the sample points at Y-values clustering near ~2,500, ~13,500, ~14,400, and ~20,500) suggests the data may represent discrete regimes or time periods rather than a purely continuous linear process. As X increases, Y tends to decrease, but the relationship is clearly not a tight linear fit — it looks more like a downward-sloping trend with substantial vertical scatter within each X range.
2. Strength, Direction, and Statistical Confidence
The correlation coefficient (r = -0.640) indicates a moderate negative linear relationship, with R² = 0.410 meaning only about 41% of the variance in Y is explained by X — leaving roughly 59% of Y's variability attributable to other factors. The narrow 95% confidence interval [-0.660, -0.619] and p-value of ~0 confirm this correlation is highly statistically significant and precisely estimated, given the large sample size (n=3,191). However, statistical significance should not be conflated with practical strength: with only 41% shared variance, X is a partial but incomplete predictor of Y. The Granger causality results add an important temporal dimension: Y Granger-causes X (F=1.876, p=0.044) but X does NOT Granger-cause Y (F=0.637, p=0.783). This is a unidirectional relationship — past values of Y help predict future X, but past X values do not help predict future Y. This is notable because it runs counter to naive assumptions; despite the metric being framed as "IssTotNtv" (X) vs. "Open price" (Y), it is the price/metric behind Y that temporally leads X, not vice versa.
3. Patterns, Clusters, and Outliers
The sample data shows clear clustering: a large cluster of high-X (60,000–125,000), low-Y (~2,400–2,900) points; a mid-X (35,000–60,000) cluster with Y around 14,000–14,900; a low-X (8,000–30,000) cluster with Y around 13,400–13,900; and a very-low-X (4,000–14,000) cluster with high Y (18,500–21,000). This suggests the relationship may be piecewise, regime-based, or driven by distinct time periods (e.g., different market cycles or years) rather than a single continuous function. The apparent "steps" hint at non-linearity or structural breaks — possibly corresponding to different market phases (bull/bear cycles) in the 2017–2026 window rather than a smooth inverse relationship.
4. Confounding Factors and Caveats
Both variables are derived from cryptocurrency market/network data (BTC volume-issuance metric and ETH-labeled price open), which are known to be strongly influenced by shared macro factors — overall crypto market sentiment, BTC dominance cycles, regulatory news, and liquidity conditions. This raises serious concern about spurious correlation via a common underlying driver (e.g., overall market cap, time trend) rather than a direct causal link between X and Y specifically. Additionally, the mismatched labeling in the metadata (X described as an Ethereum issuance metric, but header says BTC/USDT; Y described as BTC/USDT Open but header says Ethereum) suggests possible data alignment/labeling errors that should be verified before drawing conclusions. Non-stationarity (typical of price/volume series over multi-year spans) can also inflate correlation and distort Granger causality tests unless properly differenced.
5. Actionable Recommendations
Before treating this as a meaningful trading or forecasting relationship: (a) resolve the metadata inconsistency to confirm what X and Y actually represent; (b) test for stationarity (ADF/KPSS) and rerun Granger causality on differenced/log-returns rather than levels, since raw price/metric series are often non-stationary and can produce misleading causality results; (c) investigate the clustering/banding structure — segmenting by time period or fitting a regime-switching or piecewise model may reveal a stronger and more interpretable relationship than a single linear fit; and (d) given the unidirectional Granger result, further explore Y as a leading indicator for X with lag structures around the optimal 10-period lag, while treating the current 41% R² as a ceiling on how much practical predictive power X alone provides for Y.
X dataset: CryptoDataDownload – Binance BTC/USDT Daily OHLCV
Y dataset: Ethereum Historical Data (Daily)
Part of experiment: Bitcoin - CryptoDataDownload – Binance BTC/USDT Daily OHLCV vs Ethereum Historical Data (Daily)