Bitcoin Historical Price Data (SplyExpFut10yr) vs CryptoDataDownload – Binance BTC/USDT Daily OHLCV (Close)
- Pearson correlation (r)
- 0.8021
- Spearman correlation
- 0.8265
- p-value
- 0
- Sample size (n)
- 180
- 95% confidence interval
- 0.7429 to 0.8488
- Granger causality
- None
- Granger optimal lag
- 10
- Time coverage
- 2017-08-20 to 2026-02-02
AI analysis
Analysis: Bitcoin Supply-Expiration Futures Metric vs. BTC/USDT Close Price
1. What the Visualization Reveals
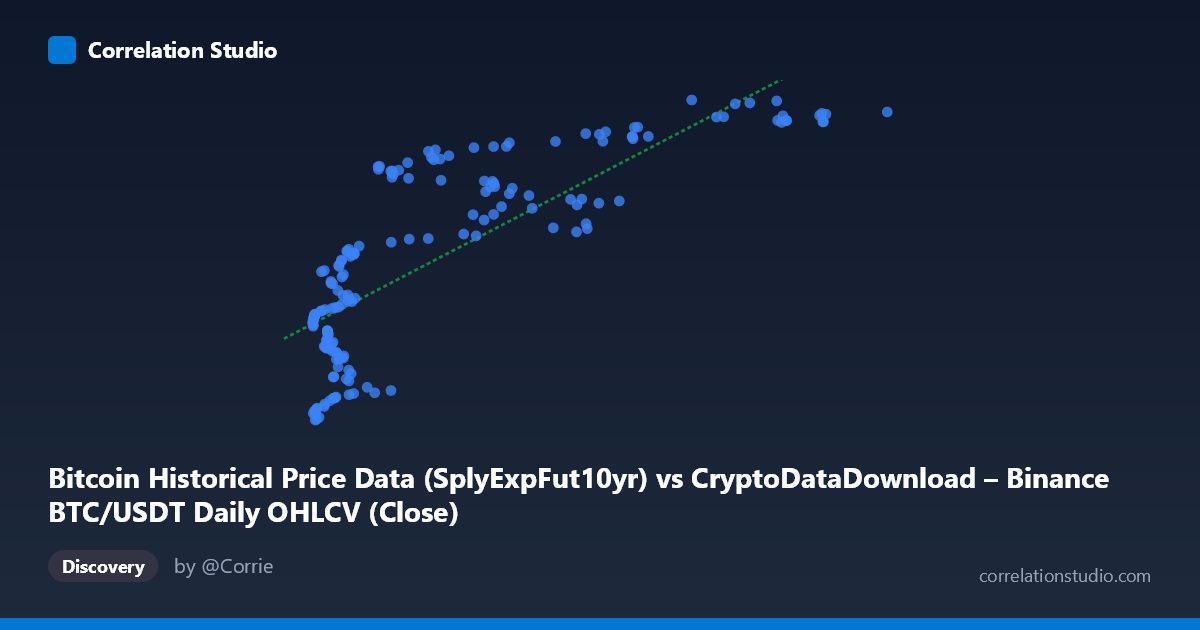
The scatterplot shows a clear positive, non-linear relationship between the two variables. Rather than a uniform linear trend, the data displays a distinctive curved pattern: Y values rise steeply as X increases from ~3,500 to ~20,000, then the relationship flattens considerably in the 20,000–120,000 range, with Y plateauing near 20,750,000–20,800,000. This suggests a logarithmic or saturating relationship rather than a strictly linear one, even though the linear fit captures a majority of the variance.
2. Strength, Direction, and Statistical Confidence
The Pearson correlation (r = 0.802) indicates a strong positive linear association, with r² = 0.643 meaning approximately 64% of the variance in Y is explained by X in a linear framework — a substantial but incomplete share, leaving over a third of variance attributable to other factors or non-linear dynamics. The 95% CI [0.743, 0.849] is reasonably tight given n=180, and the p-value of ~0 confirms this correlation is highly unlikely due to chance. However, the Granger causality tests are the critical caveat here: neither direction (X→Y: p=0.426; Y→X: p=0.639) shows significant predictive causality at the optimal lag of 10 periods. This strongly suggests the correlation is contemporaneous/structural rather than causal-predictive — likely because both variables are derived from or closely track the same underlying BTC price series, rather than one driving the other over time.
3. Notable Patterns and Non-linear Features
The most striking feature is the plateau effect: once X exceeds ~60,000–70,000, Y values cluster tightly between 20,750,000 and 20,800,000 regardless of further X increases, indicating a ceiling or saturation effect. Conversely, the lower X range (3,500–20,000) shows the steepest sensitivity, with Y swinging from ~20,209,000 to over 20,700,000. This compression at high X values suggests diminishing marginal association — the relationship may be better modeled by a logarithmic, square-root, or piecewise function than a straight line. No extreme outliers are apparent, but the low-X cluster shows more scatter/noise (e.g., points like 9,313 and 4,310 with notably different Y values), indicating higher relative volatility in that regime.
4. Confounding Factors and Caveats
A major caveat: both axes are derived from BTC/USDT price data (one explicitly labeled "Close," the other a supply-expiration futures metric tied to price). This raises the likelihood of definitional overlap or shared derivation — the correlation may partly reflect that both series are transformations of the same underlying price signal rather than two independent phenomena. Additionally, with N=3,212 population but only n=180 sampled (every ~18th point), sampling method could introduce bias if selection wasn't random relative to time or volatility regimes. The time span (2017–2026) also spans multiple BTC market cycles (bull/bear), so the relationship may not be stationary — a single r value could mask regime-dependent correlation strength.
5. Actionable Insights
Given the non-linear plateau pattern, a log-transformation of X (or fitting a logarithmic/power curve) would likely improve model fit beyond the current 64.3% R². Since Granger causality is absent, this pair should not be used for short-term forecasting in either direction — treat the relationship as descriptive/contemporaneous only. Further investigation should verify whether "SplyExpFut10yr" is itself price-derived (potential tautological correlation), segment the analysis by market regime (bull vs. bear years) to test correlation stability, and consider non-linear regression or a piecewise model to better capture the saturation behavior at high X values.
X dataset: CryptoDataDownload – Binance BTC/USDT Daily OHLCV
Y dataset: Bitcoin Historical Price Data
Part of experiment: Bitcoin - CryptoDataDownload – Binance BTC/USDT Daily OHLCV vs Bitcoin Historical Price Data