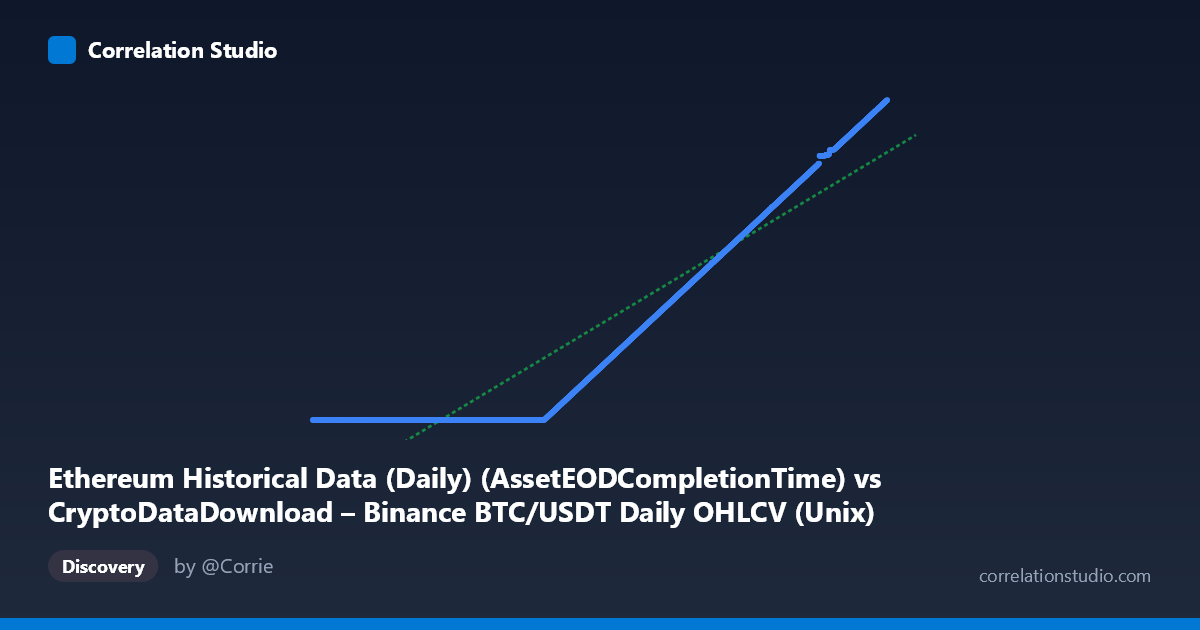
Ethereum Historical Data (Daily) (AssetEODCompletionTime) vs CryptoDataDownload – Binance BTC/USDT Daily OHLCV (Unix)
- Pearson correlation (r)
- 0.9384
- Spearman correlation
- 1
- p-value
- 0
- Sample size (n)
- 3191
- 95% confidence interval
- 0.9342 to 0.9425
- Granger causality
- None
- Granger optimal lag
- 10
- Time coverage
- 2017-08-17 to 2026-05-20
AI analysis
Analysis of the X/Y Relationship
What the Visualization Shows
This scatterplot is actually revealing something quite different from a typical "correlation between two datasets" — both columns are, in essence, timestamps. The X-axis is a Unix timestamp (in milliseconds) representing dates from a BTC/USDT OHLCV dataset, and the Y-axis is also a Unix timestamp (in seconds), labeled as coming from an Ethereum dataset but literally named "Binance BTC/USDT Daily OHLCV (Unix)" in the column header. This is a strong indication of a metadata/column-mapping mismatch: the chart is plotting one time index against another time index, not a genuine BTC vs. ETH market relationship.
Strength, Direction, and Statistical Meaning
The correlation is very high (r = 0.9384, r² = 0.881), meaning ~88% of the variance in Y is "explained" by X — but this is expected and mechanical when both axes encode time. The tight 95% CI [0.934, 0.943] and p ≈ 0 simply confirm this relationship is not due to chance, which makes sense: timestamps that both increase monotonically with real-world date will always correlate strongly. The Granger causality results reinforce this interpretation: neither direction shows significant predictive causality (p = 0.91 and p = 0.86), which is exactly what you'd expect from two timestamp series with a shared underlying driver (calendar time) rather than one variable dynamically influencing the other. In short, the statistics describe an artifact of time-encoding, not an economic or behavioral relationship between BTC and ETH.
Notable Patterns and Anomalies
The clearest anomaly is the flat plateau in the sample data: many Y-values cluster tightly around 1,614,335,xxx regardless of X ranging from 2017 through 2020. This looks like a data-quality issue — a placeholder, null-fill, or "first-seen" timestamp (corresponding to ~Feb 2021) being repeated for a large block of early X-dates before the series "unlocks" and starts tracking X almost 1:1 (Y ≈ X + ~90,000 seconds) from 2021 onward. This produces a distinctive elbow/knee shape: a horizontal band followed by a steep, near-linear diagonal — not a simple linear cloud, which is why the linear regression (R² = 0.881) understates how deterministic the post-2021 relationship actually is (likely R² ≈ 1.0 if the flat segment were removed or treated separately).
Confounding Factors and Caveats
The primary caveat is structural, not statistical: this pairing conflates two time-index columns from different platforms/datasets. The "flat" segment for dates before ~Feb 2021 suggests the Ethereum dataset's timestamp field wasn't populated/aligned correctly for that historical window, and was back-filled with a constant. Any correlation or causality metric computed across the full range is therefore contaminated by this artifact and should not be interpreted as evidence about BTC and ETH market dynamics — it says nothing about price, volume, or on-chain behavior.
Recommended Next Steps
1. Verify column mapping: Confirm the intended Y-axis variable (e.g., ETH price, gas used, tx count) wasn't mistakenly swapped with a BTC timestamp field during dataset merging/joining. 2. Isolate the pre-2021 plateau: Investigate why Y is constant (~1,614,335,xxx) for X values before 2021 — likely a default/fill value bug — and treat that segment separately or exclude it. 3. Re-run analysis on corrected data: Once the correct Y variable (actual ETH metric) is restored, redo correlation, regression, and Granger tests to get a meaningful economic/behavioral comparison between BTC and ETH. 4. Sanity-check timestamp units: Confirm consistent units (ms vs. s) across both columns before any further joins to avoid future misalignment.
X dataset: CryptoDataDownload – Binance BTC/USDT Daily OHLCV
Y dataset: Ethereum Historical Data (Daily)
Part of experiment: Bitcoin - CryptoDataDownload – Binance BTC/USDT Daily OHLCV vs Ethereum Historical Data (Daily)