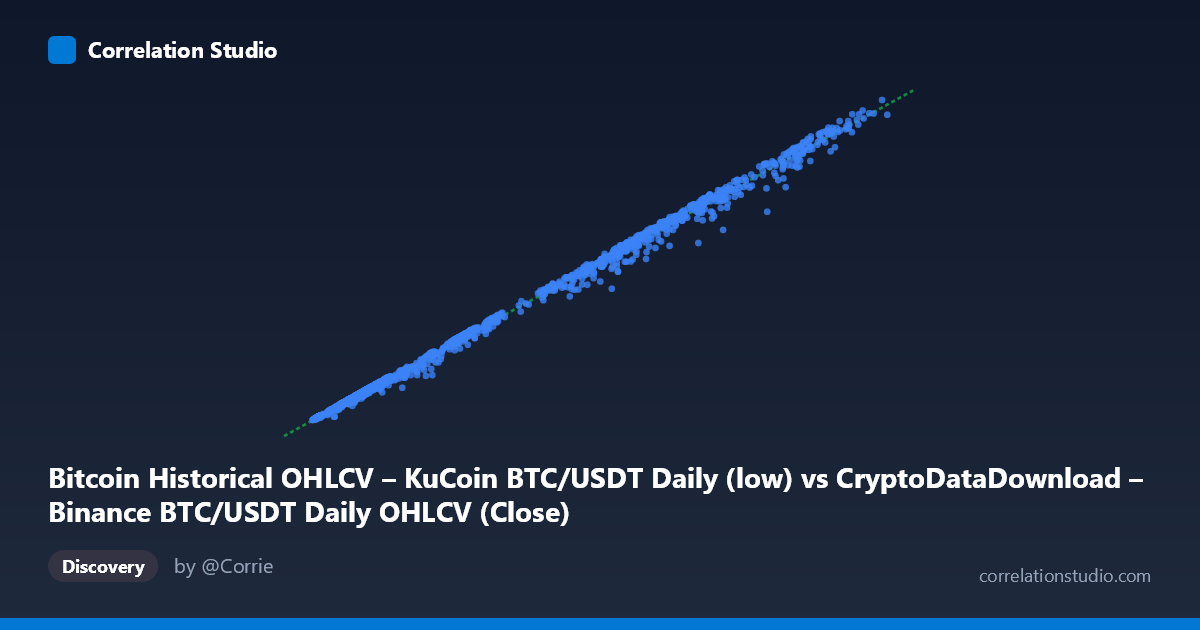
Bitcoin Historical OHLCV – KuCoin BTC/USDT Daily (low) vs CryptoDataDownload – Binance BTC/USDT Daily OHLCV (Close)
- Pearson correlation (r)
- 0.9988
- Spearman correlation
- 0.9985
- p-value
- 0
- Sample size (n)
- 1861
- 95% confidence interval
- 0.9987 to 0.9989
- Granger causality
- None
- Granger optimal lag
- 10
AI analysis
Analysis: BTC/USDT Price Correlation (Binance Low vs. KuCoin Close)
1. What the Visualization Reveals
The scatterplot shows an almost perfectly linear relationship between Binance's daily low price and KuCoin's daily close price for BTC/USDT, spanning roughly $3,200 to $67,500 over a five-year period (2017–2022). Points hug the regression line (y = 0.966x − 5.15) tightly across the entire price range, with no visible divergence at low or high price levels — the relationship appears to hold consistently through multiple market regimes (the 2018 bear market, 2020 accumulation, 2021 bull run, and 2022 correction).
2. Strength, Direction, and Predictive Relationship
This is a near-perfect positive correlation (r = 0.9988, r² = 0.9977), meaning ~99.8% of the variance in KuCoin's close price is statistically explained by Binance's low price. The tight confidence interval [0.9987, 0.9989] and p-value of 0 (effectively unmeasurable at this sample size) indicate this relationship is not due to chance — with n=1,861 daily observations, even small deviations from perfect correlation would be statistically detectable, so this is about as strong as real-world financial data gets. However, the Granger causality tests show no significant predictive direction in either direction (X→Y: p=0.54; Y→X: p=0.53). This is a critical distinction: the two series move together contemporaneously but neither leads the other in time. Practically, this means you cannot use Binance's low today to forecast KuCoin's close tomorrow (or vice versa) — the correlation is synchronous, not causal or anticipatory.
3. Notable Patterns and Caveats on Linearity
The relationship appears linear across the full range with no obvious curvature, though the regression slope (0.966) being slightly below 1.0 combined with a small negative intercept suggests KuCoin's close is marginally lower than Binance's low on average — consistent with the low being a natural floor within a day while the close can land anywhere. No dramatic outlier clusters are apparent in the sampled points, though it's worth noting that arbitrage/liquidity gaps between exchanges would likely widen in absolute-dollar terms at higher price levels even if the relationship remains proportionally tight (heteroscedasticity in absolute dollar terms is common in crypto pairs but may be masked by the log-scale-like spread of this range).
4. Confounding Factors
The near-1:1 relationship is expected and mechanically driven: both series track the same underlying asset (BTC/USDT) across two closely arbitraged exchanges. This isn't two independent phenomena correlating — it's the same market phenomenon measured twice, with cross-exchange arbitrageurs enforcing price convergence within minutes. The "correlation" here reflects market efficiency and arbitrage activity rather than an economic relationship worth causal investigation. Additionally, using "low" vs. "close" as different price points within/across candles introduces a structural, non-causal relationship (both are functions of the same volatility envelope on a given day).
5. Actionable Insights
Given the mechanical nature of this relationship, further investigation should focus on: (a) analyzing the residuals (KuCoin close − predicted value) to identify periods of unusual cross-exchange divergence, which could signal arbitrage opportunities, liquidity crunches, or exchange-specific stress events (e.g., outages, regulatory news); (b) checking whether the small residual spread widens during high-volatility periods (2021 bull run, 2022 crash) using rolling window correlation/error metrics rather than a single aggregate r; and (c) since Granger causality is absent, any trading strategy should not assume lead-lag exploitability between these two series — instead, focus on same-day/intraday spread trading or basis analysis rather than forecasting one from the other.
X dataset: CryptoDataDownload – Binance BTC/USDT Daily OHLCV
Y dataset: Bitcoin Historical OHLCV – KuCoin BTC/USDT Daily
Part of experiment: Bitcoin - CryptoDataDownload – Binance BTC/USDT Daily OHLCV vs Bitcoin Historical OHLCV – KuCoin BTC/USDT Daily