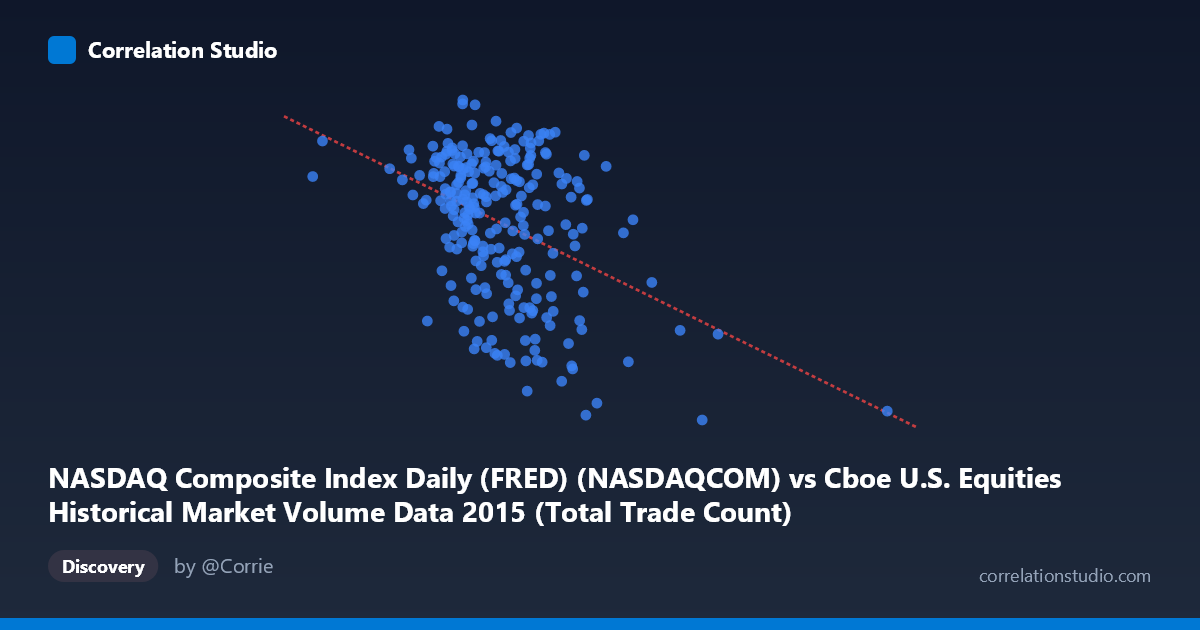
NASDAQ Composite Index Daily (FRED) (NASDAQCOM) vs Cboe U.S. Equities Historical Market Volume Data 2015 (Total Trade Count)
- Pearson correlation (r)
- -0.408
- Spearman correlation
- -0.3115
- p-value
- 0
- Sample size (n)
- 252
- 95% confidence interval
- -0.5061 to -0.2995
- Granger causality
- None
- Granger optimal lag
- 10
AI analysis
Analysis: NASDAQ Composite Index vs. Cboe U.S. Equities Total Trade Count (2015)
Relationship Overview
The scatterplot reveals a moderate negative relationship between the NASDAQ Composite Index level and the total trade count in U.S. equities markets during 2015. As the NASDAQ index rises, the number of trades tends to decrease — a counterintuitive finding at first glance, but one that aligns with a well-documented market microstructure phenomenon: elevated trading activity (fragmentation and high-frequency volume) tends to cluster during periods of uncertainty and volatility, which typically coincide with lower index levels. The linear regression equation (y = −0.000138x + 5,288.89) confirms this inverse slope, with trade counts declining by roughly 138 trades per unit increase in the index.
Correlation Strength and Statistical Significance
The Pearson correlation of r = −0.408 indicates a moderate negative association, but the r² of 0.1665 is the more sobering figure — only about 16.7% of the variance in total trade count is explained by the NASDAQ index level alone. The remaining ~83% is attributable to other factors entirely. The 95% confidence interval of [−0.506, −0.300] is meaningfully away from zero, and the p-value of 1.58 × 10⁻¹¹ confirms this is highly statistically significant — not a sampling artifact. However, statistical significance here is partly a function of the large population size (N = 3,302), which gives substantial power to detect even modest effects. Critically, the Granger causality tests reveal no significant temporal predictive relationship in either direction (X→Y: p = 0.185; Y→X: p = 0.824), meaning that knowing today's NASDAQ level does not meaningfully help predict tomorrow's trade count, and vice versa. This decouples the correlation from any actionable forecasting utility.
Notable Patterns, Clusters, and Outliers
Several features stand out in the data. The bulk of observations cluster in the X range of roughly 1,800,000–3,200,000 (NASDAQ values), with Y (trade count) concentrated between approximately 4,600–5,200. There is a visible right-side tail of high-X outliers — notably the point near (4,083,022, 4,506), which represents one of the lowest trade counts at one of the highest index levels, strongly pulling the regression slope. A cluster of lower-index, higher-trade-count observations (X < 2,000,000, Y 5,050) reinforces the negative trend and likely corresponds to volatile market periods in 2015 (e.g., the August 2015 correction). The point at approximately (997,371, 5,048) appears to be a significant outlier on the low-X end, potentially a data anomaly or a partial trading day worth investigating.
Confounding Factors and Caveats
Several important caveats limit causal interpretation. Trade count is influenced by algorithmic and high-frequency trading strategies that respond to volatility (VIX), not index levels per se — the correlation with NASDAQ may be a proxy for a volatility relationship. Seasonality plays a role: trade volumes are typically lower in summer months and year-end, and NASDAQ levels trended upward during parts of 2015 before the August correction, creating a spurious time-driven correlation. The dataset conflates all U.S. equity exchanges and TRFs, so the NASDAQ index is not the direct underlying asset for all trades counted. Additionally, the sample is from a single calendar year (2015), limiting generalizability — this was an atypical year with a notable flash crash event that likely disproportionately influences the clustering observed.
Actionable Insights and Further Investigation
Given the lack of Granger causality, this relationship should not be used for predictive trading or operational forecasting without substantial augmentation. Recommended next steps include: (1) incorporating realized volatility (VIX) or intraday range as a covariate to disentangle the volatility-driven trade count effect from index-level effects; (2) running a time-series decomposition to remove trend and seasonal components before re-examining the correlation; (3) segmenting the data by market regime (pre/post August 2015 correction) to test whether the negative correlation holds consistently or is regime-dependent; and (4) expanding the time window beyond 2015 to assess whether this relationship is structural or idiosyncratic to that year's volatility environment. The August 2015 outlier cluster warrants isolation as a separate analytical case.
X dataset: Cboe U.S. Equities Historical Market Volume Data 2015
Y dataset: NASDAQ Composite Index Daily (FRED)
Part of experiment: Daily - Cboe U.S. Equities Historical Market Volume Data 2015 vs NASDAQ Composite Index Daily (FRED)