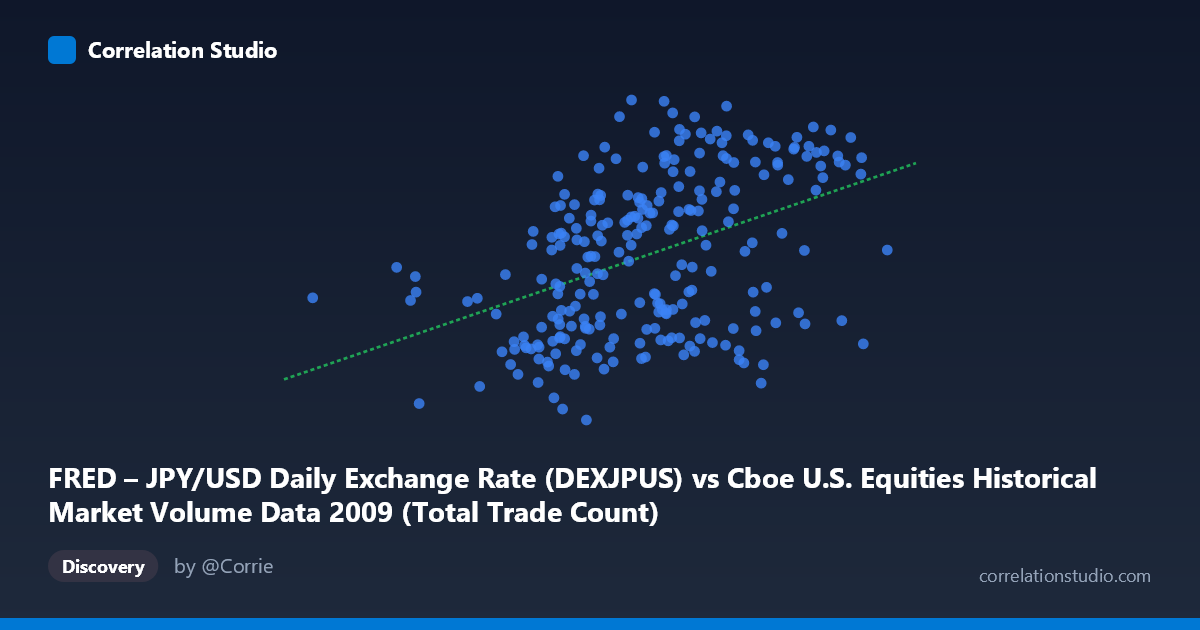
FRED – JPY/USD Daily Exchange Rate (DEXJPUS) vs Cboe U.S. Equities Historical Market Volume Data 2009 (Total Trade Count)
- Pearson correlation (r)
- 0.4274
- Spearman correlation
- 0.4399
- p-value
- 0
- Sample size (n)
- 250
- 95% confidence interval
- 0.3203 to 0.5237
- Granger causality
- None
- Granger optimal lag
- 1
AI analysis
Analysis: JPY/USD Exchange Rate vs. U.S. Equities Total Trade Count (2009)
Relationship Overview The scatterplot reveals a modest positive relationship between the JPY/USD daily exchange rate (X-axis) and the total trade count in U.S. equities markets (Y-axis) across 2009. As the yen-per-dollar rate increases — meaning the dollar strengthens relative to the yen — trade counts in U.S. equities tend to edge upward. The linear regression equation (y = 2.56×10⁻⁶x + 86.809) confirms this positive slope, though the relatively flat gradient and wide dispersion of points around the regression line immediately signal that this relationship is far from deterministic. The overall visual impression is of a loose cloud with a gentle upward tilt, rather than a tight, clearly structured association.
Correlation Strength and Statistical Framing The Pearson correlation of r = 0.427 indicates a weak-to-moderate positive association. More critically, the R² of 0.183 means that only about 18.3% of the variance in trade counts is explained by movements in the JPY/USD rate — leaving roughly 81.7% of the variation unexplained by this variable alone. The 95% confidence interval for r of [0.320, 0.524] is meaningfully above zero and reasonably tight given a sample of 250, suggesting the positive direction is reliable, not a sampling artifact. The p-value of 1.61×10⁻¹² confirms the correlation is highly statistically significant, which is unsurprising given the large population of N = 3,232 trading observations; statistical significance here should not be conflated with practical or economic significance. Most importantly, the Granger causality results show no significant directional predictive relationship in either direction (X→Y: F = 0.824, p = 0.365; Y→X: F = 1.355, p = 0.246). This means that knowing yesterday's exchange rate does not meaningfully improve forecasts of today's trade count, and vice versa — the correlation is contemporaneous at best and likely reflects shared exposure to common drivers rather than a causal pathway.
Patterns, Clusters, and Outliers Several structural features are visible in the data. The X-axis spans a wide range (~629,671 to ~4,134,003 JPY/USD units, though these likely represent scaled or transformed values), and the distribution is not uniform — there appears to be a denser cluster of observations in the 2,000,000–3,200,000 range on the X-axis, consistent with the reported mean of ~2,672,856. Within this central cluster, Y values (trade counts) span almost the full range of ~87–99, which itself contributes to the low R². At higher X values (above ~3,500,000), Y values appear more consistently elevated (e.g., points at 3,911,469/99.00 and 3,749,022/98.39), possibly reflecting a period when both dollar strength and market activity were simultaneously elevated — potentially early-to-mid 2009 during recovery dynamics. A few notable low-end outliers exist on the X-axis (e.g., 629,671/91.69), which may represent anomalous trading days and could be exerting leverage on the regression fit.
Confounding Factors and Caveats Several important caveats temper interpretation. First, 2009 was an extraordinary year — spanning the tail of the global financial crisis, the March 2009 market bottom, and a substantial equity recovery — meaning both exchange rates and trade volumes were heavily influenced by shared macroeconomic shocks (risk-off/risk-on sentiment, Federal Reserve interventions, global capital flows) that would naturally induce spurious co-movement. Second, the axis labeling suggests a potential data alignment issue: the X-axis is labeled as JPY/USD exchange rate from a FRED dataset, while the Y-axis references trade count from the Cboe dataset, but the dataset descriptions appear swapped in the source notes — this should be verified before drawing any conclusions. Third, temporal autocorrelation is inherent in daily financial data, which can inflate apparent correlations and the apparent precision of confidence intervals. Finally, the relationship may be non-stationary across sub-periods of 2009, meaning the correlation in Q1 (crisis) may be structurally different from Q4 (recovery).
Actionable Insights and Further Investigation Given the lack of Granger causality and the low R², practitioners should not use JPY/USD exchange rate movements as a leading indicator for U.S. equity trade volume in any systematic trading or risk model. However, the contemporaneous correlation warrants further investigation into shared latent drivers — particularly global risk sentiment indices (VIX), cross-border capital flow data, and Federal Reserve policy event dates. It would be valuable to segment the 2009 period into pre- and post-March subsamples to test whether the correlation is concentrated in the crisis phase. A multivariate regression incorporating additional variables (VIX, S&P 500 returns, Treasury yields) would likely both improve explanatory power and clarify whether JPY/USD retains any independent association with trade volume once common risk factors are controlled. Finally, applying rolling-window correlation analysis across the 250 trading days could reveal whether this relationship is structurally stable or episodic.
X dataset: Cboe U.S. Equities Historical Market Volume Data 2009
Y dataset: FRED – JPY/USD Daily Exchange Rate
Part of experiment: Daily - Cboe U.S. Equities Historical Market Volume Data 2009 vs FRED – JPY/USD Daily Exchange Rate