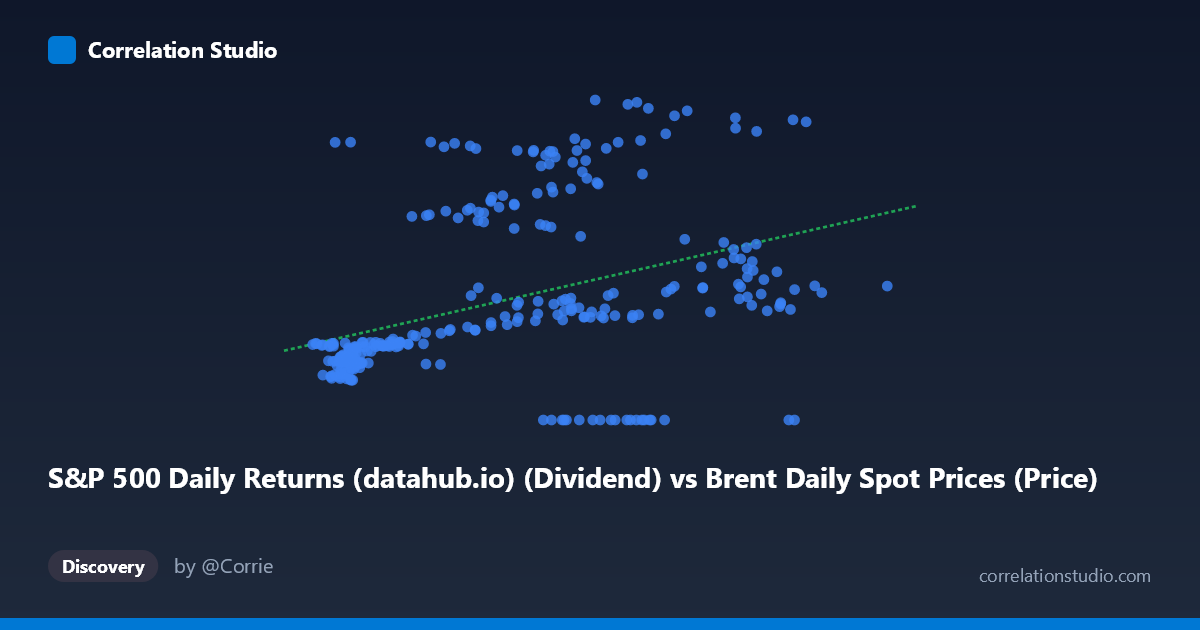
S&P 500 Daily Returns (datahub.io) (Dividend) vs Brent Daily Spot Prices (Price)
- Pearson correlation (r)
- 0.4076
- Spearman correlation
- 0.5278
- p-value
- 0
- Sample size (n)
- 297
- 95% confidence interval
- 0.308 to 0.4983
- Granger causality
- None
- Granger optimal lag
- 1
AI analysis
Analysis: Brent Crude Oil Prices vs. S&P 500 Dividends
1. Overall Relationship Pattern
The scatterplot reveals a modest positive relationship between Brent crude oil spot prices (X-axis) and S&P 500 dividend levels (Y-axis), with the linear regression line (y = 0.216x + 14.16) capturing a general upward trend across the data range (~10 to ~141 on X, ~0 to ~69 on Y). However, the relationship is far from clean — the scatter around the regression line is substantial, and the data exhibits considerable dispersion at nearly every X value. This wide spread immediately signals that oil prices alone are a weak predictor of dividend levels, and that multiple other forces are clearly at work shaping both series over the 1987–2026 timeframe.
2. Correlation Strength, Statistical Significance, and Causality
The Pearson r of 0.408 indicates a weak-to-moderate positive correlation, but the more meaningful figure is r² = 0.166, meaning Brent crude prices statistically explain only ~16.6% of the variance in S&P 500 dividends — leaving over 83% unexplained by this relationship alone. The 95% confidence interval of [0.308, 0.498] confirms the effect is reliably distinguishable from zero, and the p-value of 2.59×10⁻¹³ makes it highly statistically significant given the large sample (N = 1,865 population, n = 297 paired observations). Critically, however, Granger causality tests in both directions fail to reach significance (X→Y: F = 1.19, p = 0.276; Y→X: F = 0.10, p = 0.755), meaning neither variable meaningfully predicts the future trajectory of the other at a one-period lag. The correlation, while real in a cross-sectional sense, does not reflect a temporal predictive relationship — both series are likely being driven by shared macroeconomic forces rather than one causing the other.
3. Notable Patterns, Clusters, and Outliers
Several structural features stand out visually. There is a dense cluster of low-X, low-Y points (roughly X < 30, Y < 20), likely corresponding to the pre-2000 era of relatively low oil prices and lower nominal dividend levels. A second, more dispersed cluster appears in the mid-to-high X range (X = 50–100), where Y values spread dramatically from near 0 to nearly 68 — suggesting that at higher oil price levels, dividend behavior becomes far more variable. The zero-Y outliers (e.g., points at (73.63, 0.00), (67.09, 0.00), (84.82, 0.00), (86.92, 0.00)) are particularly striking, likely representing months with no recorded dividend payment or data gaps, and could distort the regression. Additionally, the note that Spearman ρ exceeds Pearson r is an important flag: the true relationship is likely non-linear (logarithmic or polynomial), meaning the linear model understates the correlation at lower oil price ranges while overestimating predictability at higher ranges.
4. Confounding Factors and Interpretive Caveats
This correlation almost certainly reflects shared long-run nominal trends rather than any direct economic linkage. Both Brent crude prices and S&P 500 dividends have risen substantially in nominal terms from the late 1980s to the 2020s, driven by common factors: inflation, global economic growth cycles, monetary policy regimes, and USD purchasing power erosion. This is a textbook case where a spurious correlation driven by co-trending time series can inflate apparent statistical association. The dataset spans nearly four decades (1987–2026), incorporating the 1990 Gulf War oil shock, the 2008 financial crisis, the 2014–2016 oil collapse, and the 2020 COVID shock — structurally different regimes that affect both variables independently. The mismatch in data granularity (daily Brent prices vs. monthly S&P 500 dividend data) also introduces temporal aggregation bias.
5. Actionable Insights and Further Investigation
Given the weak explanatory power and absent Granger causality, oil price alone should not be used as a dividend forecasting tool. However, several productive next steps exist. First, detrending or differencing both series (using log returns or first differences) would strip away the shared nominal trend and test whether a genuine short-run relationship persists — likely weakening the correlation substantially. Second, fitting a logarithmic or polynomial regression (as suggested by the Spearman/Pearson divergence) could better characterize the non-linear structure visible in the data. Third, regime-segmented analysis — separating pre- and post-2000 periods, or isolating recession years — might reveal whether the correlation is driven by specific macro environments like commodity supercycles. Finally, introducing multivariate controls (GDP growth, interest rates, earnings growth) would help isolate whether any residual oil–dividend link reflects genuine energy-sector dividend sensitivity or purely a macroeconomic co-movement artifact.
X dataset: Brent Daily Spot Prices
Y dataset: S&P 500 Daily Returns (datahub.io)
Part of experiment: Daily - Brent Daily Spot Prices vs S&P 500 Daily Returns (datahub.io)