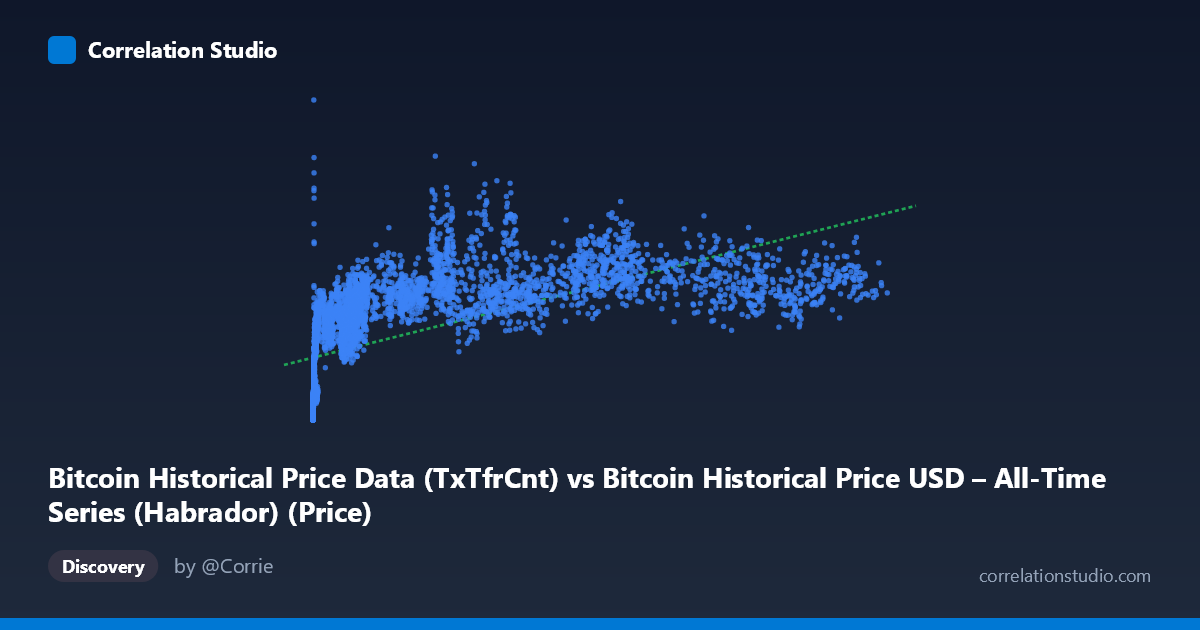
Bitcoin Historical Price Data (TxTfrCnt) vs Bitcoin Historical Price USD – All-Time Series (Habrador) (Price)
- Pearson correlation (r)
- 0.6314
- Spearman correlation
- 0.9026
- p-value
- 0
- Sample size (n)
- 5789
- 95% confidence interval
- 0.6157 to 0.6467
- Granger causality
- None
- Granger optimal lag
- 10
- Time coverage
- 2010-07-18 to 2026-05-23
- Recomputed on refreshed data
- 2026-10-24 (r was 0.6289)
AI analysis
Analysis: Bitcoin Transaction Count vs. Price
1. Relationship Overview
The scatterplot depicts Bitcoin's daily transaction count (TxTfrCnt) plotted against its USD price across nearly the entire trading history (2010–2026). The data reveals a clear but non-uniform positive relationship: as transaction counts rise, price tends to rise as well, but the pattern is heavily compressed at low X-values and spreads dramatically at higher ones. Notably, a large cluster of points sits at very low transaction counts (single digits to hundreds) with prices ranging from under $1,000 to over $100,000 — reflecting Bitcoin's early years when transaction volume was minimal but later price appreciation was already underway. Conversely, at high transaction counts (20,000–120,000+), prices cluster more tightly in the $700K–$2M range, suggesting saturation effects.
2. Correlation Strength and Statistical Confidence
The Pearson correlation (r = 0.629) indicates a moderate positive linear relationship, with r² = 0.396 meaning only ~40% of the variance in price is explained by transaction count alone — the majority of price movement is driven by other factors. The tight confidence interval [0.613, 0.645] and p-value of ~0 confirm this correlation is highly statistically reliable given the large sample (n = 5,764), not a product of chance. However, statistical significance here reflects sample size, not necessarily practical predictive power. Critically, the Granger causality tests show no significant predictive direction in either direction (X→Y: p = 0.974; Y→X: p = 0.459) — meaning neither transaction count nor price reliably "leads" the other in a time-series forecasting sense at the tested lag structure. This is an important caveat: correlation exists cross-sectionally, but neither variable is a validated leading indicator of the other.
3. Notable Patterns and Non-linearity
The most striking feature is the curvature: low X-values show enormous price variance (from ~$150 to $800K+), while the relationship appears to flatten or plateau at high transaction counts. This strongly suggests a logarithmic or power-law relationship rather than linear — consistent with the note that Spearman's ρ exceeds Pearson's r. Bitcoin's price has grown exponentially over cycles while transaction throughput has grown more linearly/logistically (constrained by block size and network capacity), producing this fan-shaped, concave pattern. There also appear to be distinct "regime clusters" corresponding to bull/bear cycles (e.g., 2013, 2017, 2021, 2024-25 peaks), where price surges without proportional transaction growth, and periods where transaction count rises during price consolidation.
4. Confounders and Caveats
The most significant confound is time itself: both price and transaction count have trended upward over 15+ years due to adoption, making this likely a spurious or partially spurious correlation driven by a shared temporal trend rather than a direct causal mechanism. Other confounders include: network capacity constraints (block size limits capping transaction count regardless of demand), the rise of off-chain/Layer-2 solutions (Lightning Network) that decouple economic activity from on-chain transaction counts, exchange and institutional trading volume (unrelated to on-chain transfers), and macroeconomic factors (interest rates, regulatory news, halving cycles) that drive price independent of network usage.
5. Recommendations for Further Investigation
Given the non-linear pattern, refit the model using log-transformed variables (log(price) ~ log(TxTfrCnt) or log(TxTfrCnt)) to better capture the power-law dynamic and likely improve explained variance. Since Granger causality was insignificant, consider testing alternative on-chain metrics (active addresses, transaction value rather than count, hash rate, exchange inflows) which may have stronger predictive relationships. Detrending both series (e.g., using differences or percentage changes rather than levels) would help isolate whether short-term transaction spikes coincide with price moves, controlling for the shared long-term growth trend. Finally, segmenting the analysis by market cycle (bull vs. bear phases) may reveal that the price-transaction relationship is regime-dependent rather than stable across the full time series.
X dataset: Bitcoin Historical Price USD – All-Time Series (Habrador)
Y dataset: Bitcoin Historical Price Data
Part of experiment: Bitcoin - Bitcoin Historical Price USD – All-Time Series (Habrador) vs Bitcoin Historical Price Data