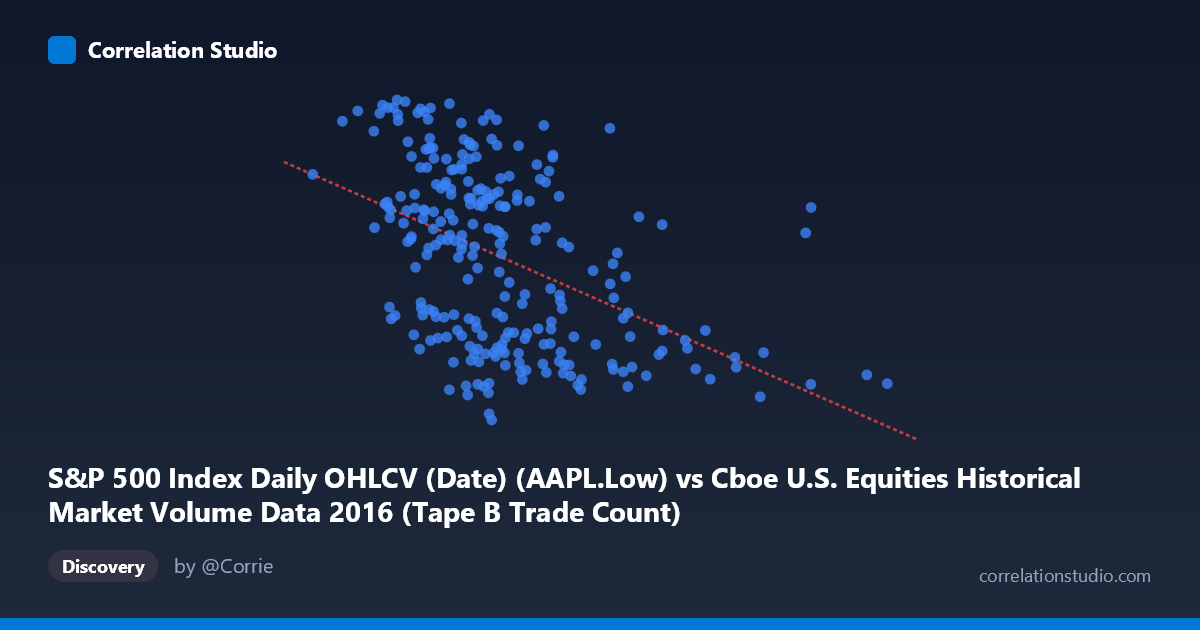
S&P 500 Index Daily OHLCV (Date) (AAPL.Low) vs Cboe U.S. Equities Historical Market Volume Data 2016 (Tape B Trade Count)
- Pearson correlation (r)
- -0.462
- Spearman correlation
- -0.4906
- p-value
- 0
- Sample size (n)
- 252
- 95% confidence interval
- -0.554 to -0.359
- Granger causality
- None
- Granger optimal lag
- 1
AI analysis
Analysis: AAPL Low Price vs. Cboe Tape B Trade Count (2016)
Relationship Overview The scatterplot reveals a moderate negative relationship between Apple's daily low price (X-axis) and the Cboe U.S. Equities Tape B trade count (Y-axis) across 252 trading days in 2016. As AAPL's low price increases, Tape B trade counts tend to decrease, suggesting that periods when Apple shares traded at higher price levels coincided with reduced trading activity on Tape B venues. The linear regression equation (y = -3.74E-05x + 115.639) quantifies this inverse slope, though the scatter around the regression line is substantial, indicating that the relationship is real but far from deterministic.
Correlation Strength and Statistical Significance The Pearson correlation of r = -0.4620 indicates a moderate negative association. Critically, the R² of 0.2135 means that only about 21.3% of the variance in Tape B trade counts is explained by AAPL's low price — leaving nearly 79% attributable to other factors. The 95% confidence interval of [-0.554, -0.359] is entirely negative and reasonably narrow, lending confidence that the true population correlation is meaningfully negative rather than near zero. The p-value of 9.99E-15 is extraordinarily small (n=252), confirming the correlation is highly statistically significant and extremely unlikely to be a sampling artifact. However, Granger causality tests reveal no significant temporal predictive direction in either direction (X→Y: F=0.896, p=0.345; Y→X: F=0.733, p=0.393), meaning that knowing AAPL's low price today does not reliably help predict tomorrow's Tape B trade count, and vice versa. This important result signals that while the contemporaneous correlation exists, it likely reflects a shared underlying driver rather than any direct or lagged causal mechanism between these two variables.
Notable Patterns, Clusters, and Outliers The sample points reveal notable structural features. The bulk of the data clusters in the AAPL low price range of roughly 225,000–375,000 (in the scaled units shown), with Tape B trade counts spanning widely between ~89 and ~117 — suggesting high within-period volatility in trading activity even at similar price levels. A distinct cluster of lower-price, higher-count observations is visible in the left portion of the chart (e.g., points near 189,000–252,000 with counts above 110), consistent with the negative trend. Conversely, several high-price outliers (notably the point near 558,190 with a count of ~94.94) sit far to the right of the main cluster, potentially exerting leverage on the regression line. Points like (309,062, 89.47) — the apparent minimum trade count — and (202,782, 116.78) — near the maximum — anchor the extremes and visually reinforce the negative slope. The spread at any given X value remains wide, confirming the low R².
Confounding Factors and Interpretive Caveats Several important caveats apply. First, the dataset labels appear cross-joined or mismatched — the X-axis references AAPL Low from an S&P 500 OHLCV dataset while the Y-axis references Tape B trade count from what is labeled an S&P 500 dataset, suggesting these columns may originate from different datasets merged on date. This raises the possibility that the correlation is a spurious time-series coincidence driven by shared 2016 market dynamics (e.g., AAPL's price recovery through the year correlating inversely with broader market fragmentation or volume shifts) rather than any meaningful economic link. Second, both variables are time series, meaning autocorrelation within each series could inflate apparent cross-sectional correlation. Third, macroeconomic events in 2016 — the Brexit vote, U.S. election, and Federal Reserve rate decisions — likely created shared volatility regimes affecting both variables simultaneously, acting as a common confound.
Actionable Insights and Further Investigation Given the statistically significant but modest correlation and absence of Granger causality, the most productive next steps would be: (1) conduct a partial correlation analysis controlling for market-wide volume and volatility (e.g., VIX) to determine whether the AAPL-Tape B relationship persists independently; (2) apply time-series decomposition to both variables to remove shared trend components before re-examining correlation; (3) test whether the relationship holds in other calendar years to assess robustness versus 2016-specific dynamics; and (4) investigate whether the right-tail outliers (high AAPL price, low trade count) correspond to specific market events that could explain the structural break. The lack of Granger causality strongly advises against using either variable to predict the other in a trading or operational context without substantially richer modeling.
X dataset: Cboe U.S. Equities Historical Market Volume Data 2016
Y dataset: S&P 500 Index Daily OHLCV (Date)
Part of experiment: Daily - Cboe U.S. Equities Historical Market Volume Data 2016 vs S&P 500 Index Daily OHLCV (Date)