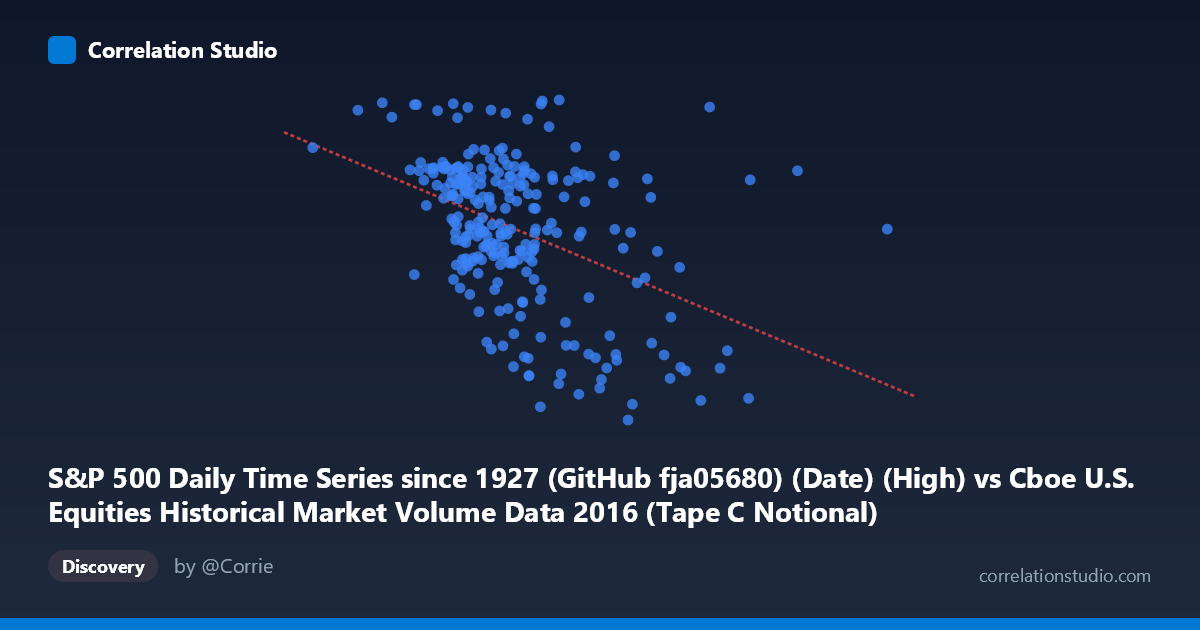
S&P 500 Daily Time Series since 1927 (GitHub fja05680) (Date) (High) vs Cboe U.S. Equities Historical Market Volume Data 2016 (Tape C Notional)
- Pearson correlation (r)
- -0.4311
- Spearman correlation
- -0.4097
- p-value
- 0
- Sample size (n)
- 252
- 95% confidence interval
- -0.5267 to -0.3249
- Granger causality
- None
- Granger optimal lag
- 4
AI analysis
Scatterplot Analysis: S&P 500 High vs. Cboe Tape C Notional Volume (2016)
Relationship Overview The scatterplot reveals a moderate negative relationship between the S&P 500 daily high price and Cboe Tape C notional trading volume across 2016. As the S&P 500 index reached higher price levels, Tape C notional volume tended to be lower, and conversely, periods of lower index prices coincided with elevated notional trading activity. This inverse pattern aligns with a well-established market dynamic: volatility and fear-driven selling typically occur at lower price levels and generate higher notional volume, while calm, trending bull markets often see reduced volume participation. The linear regression equation (y = -3.72×10⁻⁸x + 2,288.43) reflects this negative slope, though the modest intercept adjustment suggests the relationship is real but far from deterministic.
Correlation Strength and Statistical Significance The Pearson correlation of r = -0.4311 indicates a moderate negative association. However, the R² of 0.1859 is the more sobering metric — only 18.6% of the variance in Tape C notional volume is explained by the S&P 500 high, leaving over 81% attributable to other factors entirely. The 95% confidence interval of [-0.5267, -0.3249] is usefully narrow and does not cross zero, indicating the direction of the effect is consistent. The p-value of 7.87×10⁻¹³ confirms the correlation is highly statistically significant for the sample of n = 252 trading days, making random chance an implausible explanation. Critically, however, the Granger causality tests show no significant predictive direction in either X→Y or Y→X (F = 0.544, p = 0.704 and F = 1.067, p = 0.374, respectively), meaning that past S&P 500 highs do not reliably predict future notional volume, nor does past notional volume predict future index levels at the tested lag of 4 periods. The correlation is contemporaneous, not predictively structural.
Notable Patterns, Clusters, and Outliers The data cloud shows considerable vertical scatter across the full X range, consistent with the modest R². A notable cluster of points congregates between approximately 4.0–5.5 billion on the X-axis, where Tape C notional values span a wide range (~1,950–2,275), suggesting that at mid-range index values, notional volume is highly variable and poorly predicted by price alone. Several prominent outliers are visible at higher X values (above ~6.5–7.5 billion), where notional volume drops sharply to the 1,850–1,950 range — these likely correspond to specific low-volatility sessions or thin-volume days late in the year. On the lower-X end (below ~3.5 billion), there are points with unusually high notional values near 2,270–2,277, suggesting concentrated high-volume events at lower price levels, possibly linked to early-2016 market stress. The distribution does not appear strongly non-linear, but the variance clearly fans out, hinting at mild heteroscedasticity.
Confounding Factors and Caveats Several important caveats apply. Notional volume is inherently price-sensitive — it equals shares traded multiplied by price, so if share counts are relatively stable, notional volume would mechanically co-vary with price, potentially inflating any observed correlation in either direction. The fact that the observed relationship is negative despite this mechanical link suggests genuine behavioral effects dominate. Additionally, intraday timing misalignment is a concern: the X-axis uses the S&P 500 daily high (an extreme, not a central tendency), which may not best represent the day's price level relative to volume. Seasonal effects, Federal Reserve policy events, the U.S. presidential election in November 2016, and Brexit aftershocks could all confound the relationship. Furthermore, Tape C specifically covers NYSE Arca-listed securities, so the correlation reflects a subset of U.S. equity activity rather than the full market.
Actionable Insights and Further Investigation The absence of Granger causality suggests this correlation should not be used for predictive trading signals — neither variable reliably leads the other. Further investigation should consider: (1) replacing "high" with closing price or VWAP to reduce extreme-value noise; (2) regressing on log-transformed notional volume to address heteroscedasticity and potential multiplicative dynamics; (3) incorporating VIX or realized volatility as a mediating variable, since volatility likely explains much of the remaining 81% variance and may reveal that the S&P–volume relationship is largely volatility-driven; and (4) segmenting the year into distinct market regimes (e.g., the Q1 2016 selloff vs. the post-election rally) to test whether the correlation is stable or regime-dependent, which the current aggregate analysis would obscure.
X dataset: Cboe U.S. Equities Historical Market Volume Data 2016
Y dataset: S&P 500 Daily Time Series since 1927 (GitHub fja05680) (Date)
Part of experiment: Daily - Cboe U.S. Equities Historical Market Volume Data 2016 vs S&P 500 Daily Time Series since 1927 (GitHub fja05680) (Date)