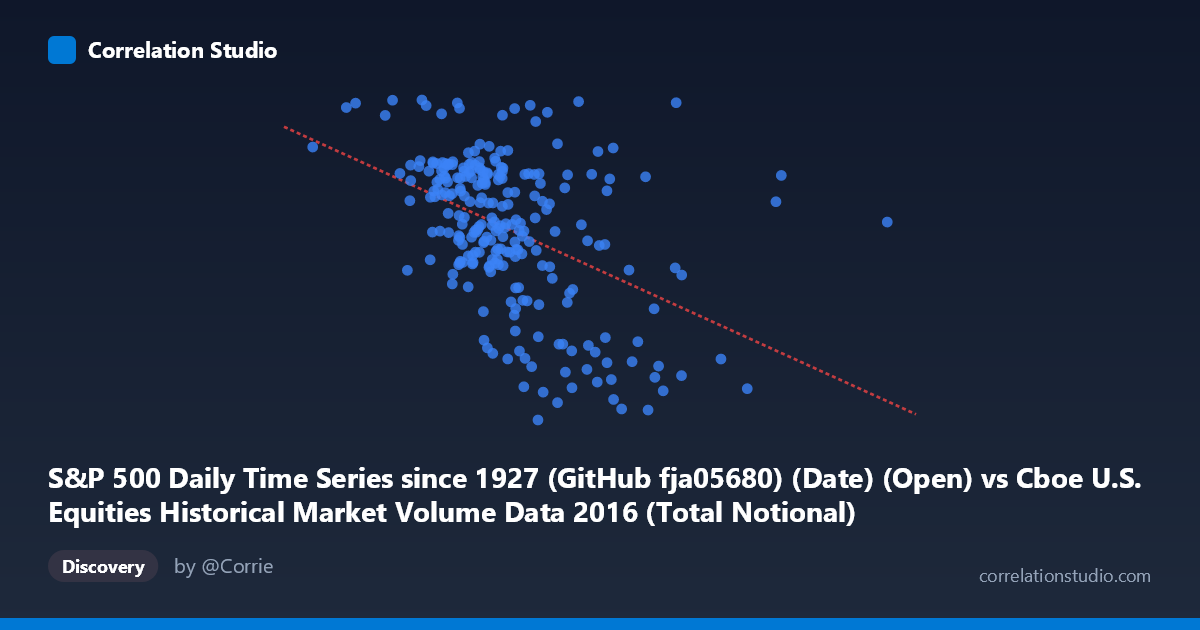
S&P 500 Daily Time Series since 1927 (GitHub fja05680) (Date) (Open) vs Cboe U.S. Equities Historical Market Volume Data 2016 (Total Notional)
- Pearson correlation (r)
- -0.4508
- Spearman correlation
- -0.457
- p-value
- 0
- Sample size (n)
- 252
- 95% confidence interval
- -0.544 to -0.3465
- Granger causality
- None
- Granger optimal lag
- 1
AI analysis
Scatterplot Analysis: S&P 500 Open Price vs. Total Market Notional Volume (2016)
Relationship Overview
The scatterplot reveals a moderate negative relationship between the S&P 500 daily open price (X-axis) and the total notional value of U.S. equity market volume (Y-axis) across 2016 trading days. As the S&P 500 opened at higher price levels, total market notional volume tended to be lower, and conversely, lower index open prices corresponded with elevated notional trading volumes. This pattern is broadly consistent with a "fear and volatility" dynamic — periods of market stress or downward pressure typically generate heavier trading activity measured in dollar terms, while calmer, higher-price environments see relatively subdued volume. The linear regression equation (y = −1.07×10⁻⁸x + 2297.59) quantifies this inverse slope, though the relationship is clearly not tight, with substantial scatter throughout.
Correlation Strength and Statistical Significance
The Pearson correlation of r = −0.4508 indicates a moderate negative association, but the explanatory power is notably limited: r² = 0.2032, meaning only about 20.3% of the variance in total notional volume is explained by the S&P 500 open price. The remaining ~80% of variation in notional volume is driven by factors not captured here. The 95% confidence interval of [−0.544, −0.347] is entirely in negative territory, confirming the inverse direction is robust and not a sampling artifact. The p-value of 5.15×10⁻¹⁴ is extraordinarily small, making this correlation highly statistically significant — the negative relationship is almost certainly real rather than due to chance, given the sample of 252 paired trading days. However, statistical significance should not be conflated with practical or predictive significance, especially given the modest r². Importantly, the Granger causality tests reveal no significant temporal predictive direction in either direction (X→Y: F = 0.71, p = 0.40; Y→X: F = 0.22, p = 0.64), meaning that knowing today's S&P 500 open price does not meaningfully help predict tomorrow's notional volume, and vice versa. The relationship is associative and concurrent rather than predictively sequential.
Notable Patterns, Clusters, and Outliers
Several structural features stand out in the data. The bulk of observations cluster in the X range of roughly 16–22 billion (open price) and Y range of 2,000–2,200 (notional volume), forming a moderately dense core cloud with a visible downward tilt. However, there are notable outliers at both extremes: - The point near (13.96B, 2270.54) — the highest notional volume observation — sits isolated at the lower-left, consistent with an early-2016 market stress event when prices were depressed and volume spiked dramatically. - Several points in the 24–26B open range show notional volumes dropping to the 1,833–1,902 range, representing the highest-price, lowest-volume days — likely mid-to-late 2016 calm trading periods. - The point (21,239M open, 2,253.77 notional) is an anomaly — high price and high volume — suggesting an event-driven day that breaks the general trend. - The rightmost observations (X 35B) appear sparse and may represent data anomalies or outlier dates that warrant scrutiny.
Confounding Factors and Interpretive Caveats
Several important caveats complicate interpretation. First, the axes appear to have dataset labels swapped in the original metadata — the X-axis is labeled as "Date (Open)" from the S&P 500 series while the Y-axis references "Total Notional" from the Cboe volume dataset, but the numerical ranges suggest the X-axis actually reflects total notional dollar volume (~$7–41 billion) and the Y-axis reflects S&P 500 open prices (~1,833–2,270), which is the more interpretable framing. Second, 2016 was a particularly eventful year (January–February selloff, Brexit in June, U.S. election in November), meaning seasonal and event-driven clustering may be inflating the apparent correlation. Third, total notional volume is itself influenced by the price of securities — higher index levels mechanically increase notional value even at constant share volumes — which creates a partial tautological suppression of correlation. Fourth, with only 252 daily observations from a single calendar year, generalizability to other market regimes is limited.
Actionable Insights and Further Investigation
Practitioners and researchers should consider several next steps. Decompose notional volume into share volume to remove the price-level mechanical effect and test whether the relationship persists on a pure activity basis. Segment the data by market regime (e.g., VIX quintiles, pre/post-Brexit, pre/post-election) to test whether the negative correlation is driven by a handful of stress episodes rather than a persistent structural relationship. Extend the time series beyond 2016 to assess whether r ≈ −0.45 is stable across bull and bear cycles or specific to this period. Given the failed Granger causality tests, traders should not expect lagged S&P open prices to reliably forecast next-day volume, though incorporating intraday volatility measures or VIX alongside price level may substantially improve predictive models. Finally, testing non-linear specifications (e.g., piecewise regression around market stress thresholds) could better capture the apparent cluster-driven nature of the relationship visible in the scatterplot.
X dataset: Cboe U.S. Equities Historical Market Volume Data 2016
Y dataset: S&P 500 Daily Time Series since 1927 (GitHub fja05680) (Date)
Part of experiment: Daily - Cboe U.S. Equities Historical Market Volume Data 2016 vs S&P 500 Daily Time Series since 1927 (GitHub fja05680) (Date)