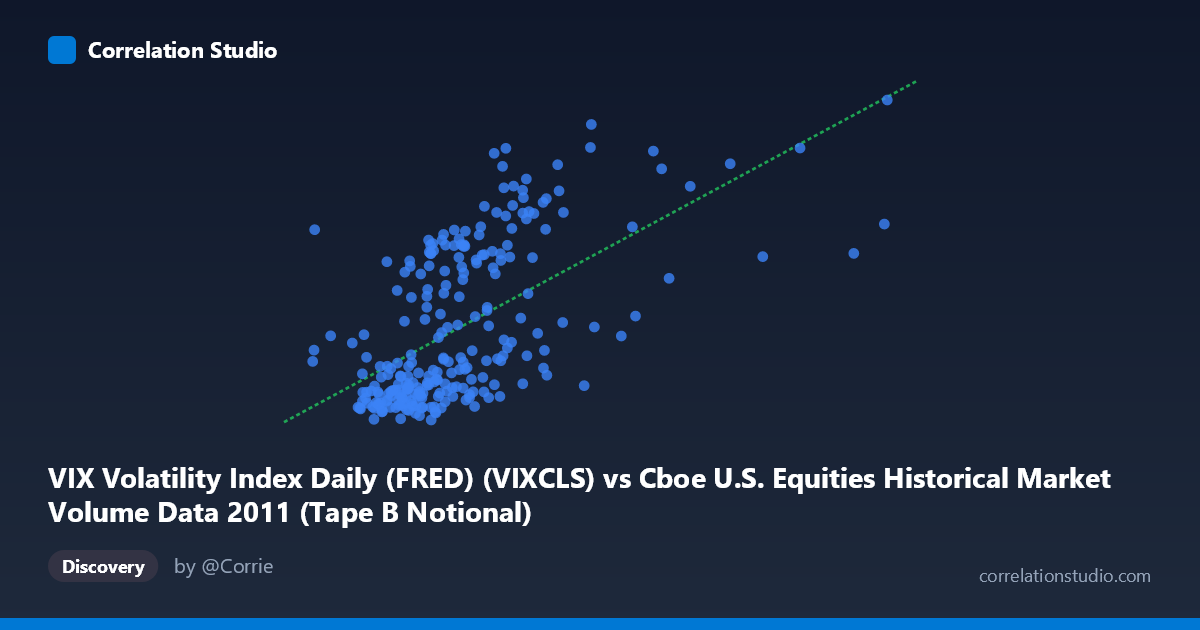
VIX Volatility Index Daily (FRED) (VIXCLS) vs Cboe U.S. Equities Historical Market Volume Data 2011 (Tape B Notional)
- Pearson correlation (r)
- 0.5937
- Spearman correlation
- 0.6268
- p-value
- 0
- Sample size (n)
- 252
- 95% confidence interval
- 0.5074 to 0.6683
- Granger causality
- None
- Granger optimal lag
- 1
AI analysis
Analysis: VIX Volatility Index vs. Cboe Tape B Notional Volume (2011)
Relationship Overview
The scatterplot reveals a moderate positive relationship between the VIX Volatility Index and Cboe Tape B notional trading volume throughout 2011. As the VIX rises — signaling greater investor fear and market uncertainty — Tape B notional volume tends to increase as well. This is consistent with well-established market microstructure theory: periods of elevated volatility typically drive higher trading activity as institutional and retail participants rebalance portfolios, hedge positions, or react to rapidly changing prices. The linear regression equation (y = 2.69e-9x + 10.45) captures this upward trend, though the scatter around the line is substantial.
Correlation Strength and Statistical Significance
The Pearson correlation of r = 0.594 indicates a moderate positive association, but the explanatory power is more sobering: R² = 0.3525, meaning only 35.3% of the variance in Tape B notional volume is accounted for by VIX levels. Nearly two-thirds of the variation in trading volume is driven by other factors entirely. The 95% confidence interval of [0.507, 0.668] is reassuringly tight given the sample of n = 252, and the p-value of effectively zero confirms this relationship is not a statistical artifact. However, the Granger causality results are notably weak — neither direction (X→Y: F = 0.030, p = 0.864; Y→X: F = 0.0001, p = 0.991) approaches significance. This means that while VIX and Tape B volume are contemporaneously correlated, neither variable reliably predicts the other in the next period, severely limiting any practical forecasting application based on this relationship alone.
Notable Patterns and Outliers
The scatterplot exhibits several visually important features. There is a clear dense cluster of observations at lower VIX values (~15–22) paired with relatively modest notional volumes (~14–25 billion range), reflecting the calmer, lower-volatility periods of early 2011. A second, more dispersed grouping appears at higher VIX readings (30–48), associated with elevated and more variable notional volumes — consistent with the summer/fall 2011 European debt crisis and U.S. debt ceiling turbulence. Several prominent outliers appear in the upper-right quadrant, where VIX readings above 35 coincide with exceptionally high notional volume (approaching 42–48 range), suggesting non-linear amplification during true market stress episodes. The relationship also appears to have a floor effect: even at low VIX levels, notional volume rarely drops below ~14, implying baseline institutional activity independent of fear levels.
Confounding Factors and Caveats
Several important caveats temper this analysis. First, 2011 was an atypical year — the U.S. debt ceiling crisis, S&P downgrade of U.S. sovereign debt, and the European sovereign debt contagion all produced clustered volatility spikes that may exaggerate the apparent VIX-volume relationship compared to more normal market years. Second, Tape B specifically covers NYSE American and regional exchange listings, making it a partial rather than comprehensive measure of market-wide activity; spillover effects from Tape A or C could confound interpretation. Third, the axes appear reversed from intuition (VIX on X, notional volume on Y), yet the Granger results confirm causality runs neither way, so the directionality assumption embedded in the regression framing should be treated cautiously. Finally, day-of-week effects, options expiration cycles, and index rebalancing dates are uncontrolled and are known to independently influence both VIX and volume.
Actionable Insights and Further Investigation
For practitioners, the moderate correlation suggests VIX can serve as a rough contemporaneous indicator of elevated Tape B activity but should not be used as a leading predictor given the failed Granger tests. Risk managers could use this relationship to scale expected market impact costs during high-VIX regimes, while acknowledging the wide residual variance. For researchers, several extensions are warranted: (1) testing non-linear models (e.g., regime-switching or threshold regression) to capture the apparent amplification effect at VIX 30; (2) expanding the time window beyond 2011 to test whether this relationship holds across full market cycles; (3) decomposing volume by trade size or participant type to identify which actors drive the VIX-volume link; and (4) incorporating lagged macro variables (credit spreads, realized volatility, futures positioning) to improve the explained variance beyond the current 35.3% ceiling.
X dataset: Cboe U.S. Equities Historical Market Volume Data 2011
Y dataset: VIX Volatility Index Daily (FRED)
Part of experiment: Daily - Cboe U.S. Equities Historical Market Volume Data 2011 vs VIX Volatility Index Daily (FRED)