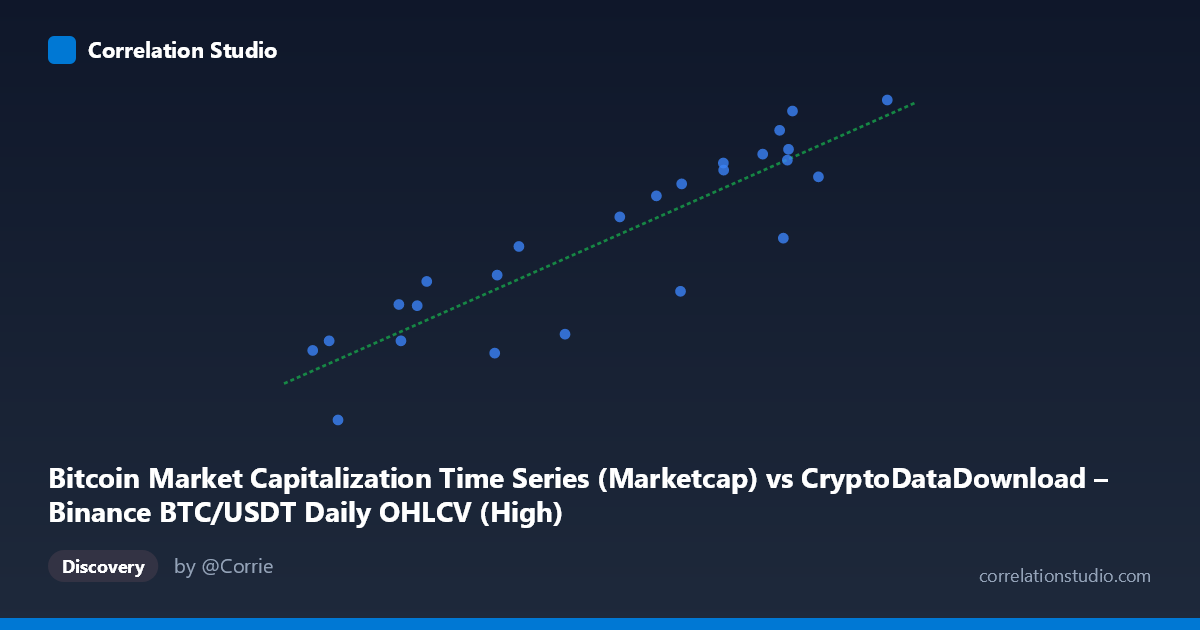
Bitcoin Market Capitalization Time Series (Marketcap) vs CryptoDataDownload – Binance BTC/USDT Daily OHLCV (High)
- Pearson correlation (r)
- 0.8945
- Spearman correlation
- 0.8915
- p-value
- 0
- Sample size (n)
- 25
- 95% confidence interval
- 0.7723 to 0.9528
- Granger causality
- None
- Granger optimal lag
- 6
- Time coverage
- 2024-03-29 to 2024-04-22
AI analysis
Analysis: Bitcoin Market Cap vs. BTC/USDT High Price
1. Relationship Overview
The scatterplot reveals a strong, positive linear relationship between Bitcoin's market capitalization and its daily high price on Binance BTC/USDT. This is expected on a near-tautological level: market cap is calculated as price × circulating supply, and since circulating supply changes only marginally over a ~25-day window (new BTC issuance is slow and predictable post-halving), these two series are essentially the same signal expressed in different units. The tight clustering of points along the regression line (y = 1.867×10⁷x + 4.069×10¹⁰) confirms this near-mechanical linkage.
2. Strength, Direction, and Uncertainty
The correlation coefficient (r = 0.8945) indicates a strong positive association, with r² = 0.80 meaning 80% of the variance in market cap is explained by price movements alone (and vice versa). The 95% confidence interval [0.772, 0.953] is reasonably tight and entirely excludes zero or negative values, while the p-value (1.66×10⁻⁹) provides overwhelming statistical significance — this relationship is not due to chance. However, the Granger causality results are notable: neither direction shows significant predictive power (X→Y: p=0.484; Y→X: p=0.759). This confirms the relationship is contemporaneous/definitional rather than one variable temporally leading the other — consistent with the fact that both series move together instantaneously because they're mathematically coupled, not because one "causes" the other in a forecasting sense.
3. Patterns and Outliers
The data shows a fairly consistent upward trend across the observed range ($64,117–$72,798), with no obvious clustering into distinct regimes. A few points deviate mildly from the regression line — for instance, (66867.07, 1248697732500) sits below the trend compared to neighboring points like (67232.35, 1316295559688), suggesting minor short-term decoupling, likely due to intraday volatility or slight supply fluctuations. No strong non-linearity or curvature is apparent; a linear model fits reasonably well, though the ~20% unexplained variance suggests some noise, possibly from supply-side data lag or reporting differences between the two data sources.
4. Confounding Factors and Caveats
The primary caveat is that this isn't really a correlation between two independent phenomena — it's two representations of the same underlying variable (price), with circulating supply as a near-constant multiplier. Any "confounding" here is actually structural rather than spurious. Differences arise mainly from: (a) data source discrepancies (Binance-only price vs. broader market-cap aggregation methodology), (b) timing mismatches (daily high vs. end-of-day snapshot used for cap calculation), and (c) minor circulating supply adjustments. The 20% unexplained variance is likely attributable to these measurement/methodology differences rather than genuine economic decoupling.
5. Suggestions for Further Investigation
Given the definitional relationship, deeper insights would come from analyzing the ratio (implied circulating supply = market cap ÷ price) to check for data quality issues or supply-schedule anomalies rather than treating this as a predictive relationship. Future analysis should instead focus on genuinely independent variable pairs (e.g., price vs. trading volume, or price vs. on-chain metrics like active addresses) where Granger causality testing would be more meaningful. If the goal is forecasting, this pair offers little value beyond confirming internal data consistency between the two sources.
X dataset: CryptoDataDownload – Binance BTC/USDT Daily OHLCV
Y dataset: Bitcoin Market Capitalization Time Series
Part of experiment: Bitcoin - CryptoDataDownload – Binance BTC/USDT Daily OHLCV vs Bitcoin Market Capitalization Time Series