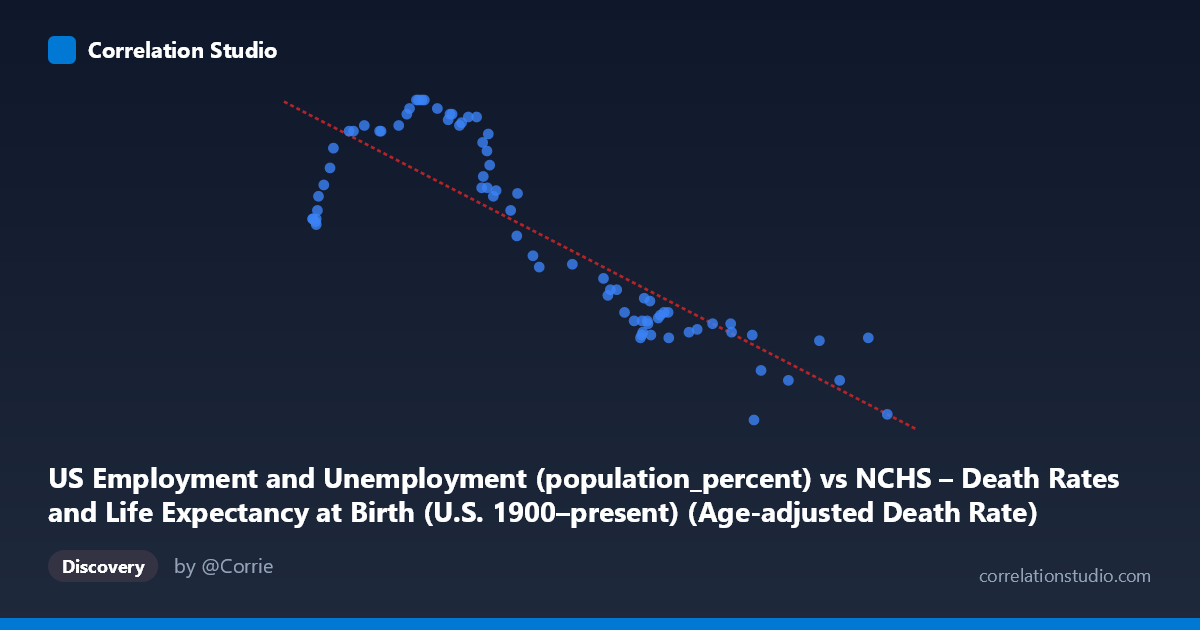
US Employment and Unemployment (population_percent) vs NCHS – Death Rates and Life Expectancy at Birth (U.S. 1900–present) (Age-adjusted Death Rate)
- Pearson correlation (r)
- -0.8419
- Spearman correlation
- -0.8083
- p-value
- 0
- Sample size (n)
- 78
- 95% confidence interval
- -0.8965 to -0.7621
- Granger causality
- None
- Granger optimal lag
- 1
- Time coverage
- 1941-01-01 to 2018-01-01
AI analysis
Analysis: US Employment Rate vs. Age-Adjusted Death Rate (1941–2018)
Relationship Overview The scatterplot reveals a strong negative relationship between the US employment rate (as a percentage of population) and the age-adjusted death rate: as employment rises, mortality tends to fall. The linear regression equation (y = -0.00998x + 74.26) indicates that for every one percentage-point increase in the employment-to-population ratio, the age-adjusted death rate declines by roughly 0.01 units. Visually, the data trace a fairly coherent downward arc from lower-left to upper-right — or more precisely, from high employment/low mortality to low employment/high mortality — consistent with what decades of public health research would anticipate about socioeconomic conditions and population health.
Correlation Strength and Statistical Framing The Pearson correlation of r = -0.842 is statistically strong, and the R² of 0.709 means that approximately 70.9% of the variance in age-adjusted death rates is accounted for by variation in employment rates alone — a remarkably high figure for a bivariate model spanning 77 years of complex social history. The 95% confidence interval of [-0.897, -0.762] is narrow and sits entirely in negative territory, reinforcing high confidence in the direction and approximate magnitude of this association. The p-value of effectively zero confirms this is not a chance finding. However, the Granger causality results are notably absent: neither direction (X→Y: F=2.11, p=0.15; Y→X: F=0.14, p=0.71) clears the significance threshold. This is a critical caveat — despite the strong contemporaneous correlation, employment rates do not demonstrably predict future death rates (or vice versa) at a one-period lag, suggesting both variables may be co-driven by a third underlying force, likely long-run economic and medical development trends, rather than one causing the other in a temporally leading sense.
Patterns, Clusters, and Outliers Several structural features stand out. There is a dense cluster in the upper-left region around employment rates of 776–820 and death rates of 62–65, likely corresponding to the early 1940s wartime and immediate postwar period. A second dense cluster appears in the middle band (employment ~950–1100, death rates ~63–67), representing the broad postwar expansion era. The upper-right tail — high death rates (66–67) paired with moderate employment (~950–980) — may reflect early decades when medical intervention was limited. At the opposite extreme, the point (1830, 56.0) stands out as a potential outlier representing the most recent years, with the highest employment and lowest mortality, anchoring the regression's lower end. The point (1585, 55.8) also sits notably low on mortality, consistent with recent decades. No dramatic non-linear curvature is immediately apparent, though a slight concavity in the mid-range suggests diminishing returns — large employment gains early in the series correspond to proportionally larger mortality reductions than equivalent gains in later decades.
Confounding Factors and Caveats This correlation almost certainly reflects shared secular trends rather than a direct causal mechanism. Both employment rates and age-adjusted death rates are strongly time-trended: employment has generally grown with population and economic expansion, while death rates have fallen dramatically due to medical advances (antibiotics, cardiovascular treatments, cancer screening), public health infrastructure, and improved nutrition — all largely independent of employment fluctuations. This common time trend is the dominant confound, and the Granger test's failure to find temporal predictive power supports this interpretation. Additionally, the employment metric used (population percent) conflates labor force participation with cyclical unemployment, masking important distinctions. Recessions may temporarily reduce employment and simultaneously worsen health outcomes, but this short-run dynamic is likely swamped in an annual, 77-year series by the dominant long-run trend. Ecological fallacy concerns also apply: these are population-level aggregates, and individual-level relationships may differ.
Actionable Insights and Further Investigation Given that the strong correlation appears largely trend-driven, the most valuable next step would be to detrend both series (e.g., first-differencing or HP filtering) and retest the correlation and Granger causality on residuals — this would reveal whether changes in employment predict changes in mortality beyond their shared secular drift. It would also be worth disaggregating by race and sex, since the source dataset contains those breakdowns and disparities in both employment and mortality are well-documented. Testing lagged relationships at 2–5 periods (rather than just lag-1) could also uncover slower-acting pathways from labor market conditions to health outcomes. Finally, introducing GDP, healthcare expenditure, or medical innovation indices as control variables in a multivariate model would help isolate whether employment carries independent explanatory power for mortality trends once technological and economic confounders are accounted for.
X dataset: NCHS – Death Rates and Life Expectancy at Birth (U.S. 1900–present)
Y dataset: US Employment and Unemployment
Part of experiment: Yearly - NCHS – Death Rates and Life Expectancy at Birth (U.S. 1900–present) vs US Employment and Unemployment