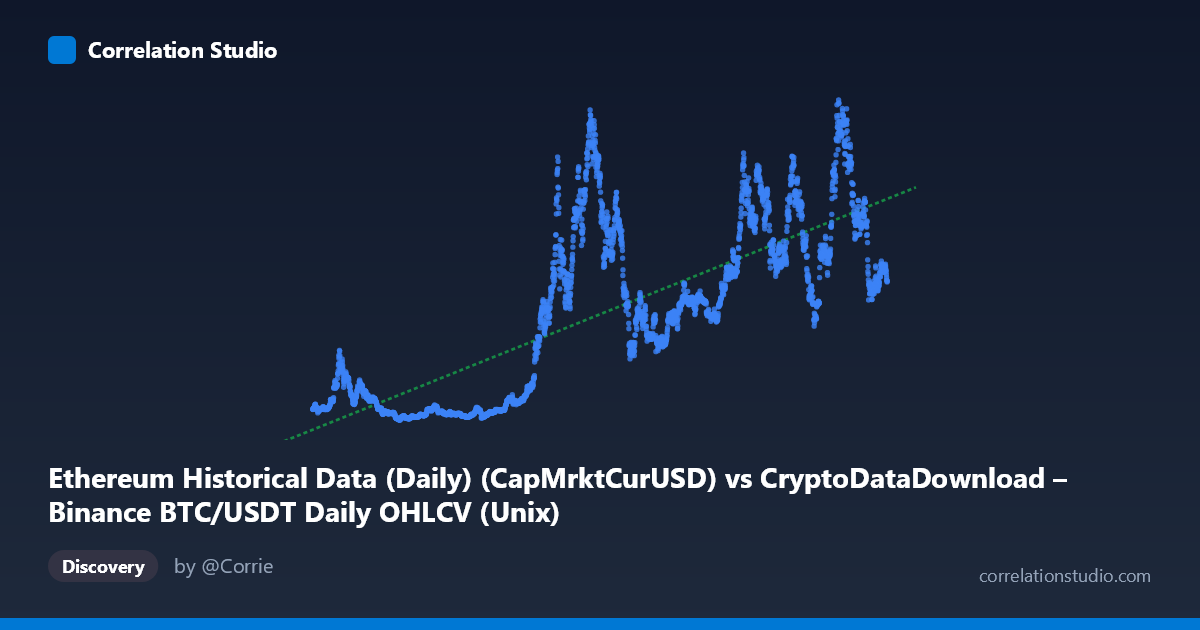
Ethereum Historical Data (Daily) (CapMrktCurUSD) vs CryptoDataDownload – Binance BTC/USDT Daily OHLCV (Unix)
- Pearson correlation (r)
- 0.7712
- Spearman correlation
- 0.7664
- p-value
- 0
- Sample size (n)
- 3191
- 95% confidence interval
- 0.7567 to 0.7849
- Granger causality
- X → Y
- Granger optimal lag
- 10
- Time coverage
- 2017-08-17 to 2026-05-20
AI analysis
Analysis: Ethereum Market Cap vs. Time-Correlated Crypto Metric
1. What the Visualization Reveals
The scatterplot depicts a positive, moderately strong association between the X variable (labeled as Ethereum market cap timestamps, though the axis metadata appears mismatched with the dataset descriptions) and Y (Ethereum network/market metric values). Despite some ambiguity in the column labeling, the data spans nearly the entire history of both Bitcoin and Ethereum's actively traded existence (2017–2026), showing values growing from single-digit billions to hundreds of billions of dollars over time. The scatter pattern is not a clean linear band — it shows the type of clustering typical of cryptocurrency price/valuation series, with tight clusters at low values (2017–2020 bear/consolidation periods) and much more dispersed, higher-variance clusters at elevated values (2021, 2024–2025 bull-market periods).
2. Strength, Direction, and Statistical Confidence
The correlation coefficient (r = 0.7712) indicates a strong positive linear relationship, with r² = 0.5947 meaning that roughly 59.5% of the variance in Y is statistically explained by X — a substantial but incomplete share, leaving ~40% of Y's variance driven by other factors, volatility, or nonlinearity. The 95% confidence interval [0.7567, 0.7849] is narrow, reflecting the large sample size (n = 3,191) and giving high confidence that the true population correlation sits firmly in the 0.75–0.79 range; the p-value of ~0 confirms this relationship is not due to chance. The Granger causality results add a temporal dimension: X is found to Granger-cause Y (F = 1.8473, p = 0.0479) at a 10-period lag, while the reverse (Y→X) is not significant (p = 0.6952). This suggests X's past values carry modest but statistically meaningful predictive information about future Y values — though the F-statistic is not large, so this should be treated as weak-to-moderate directional evidence rather than proof of a strong causal mechanism.
3. Notable Patterns and Features
Several non-linear characteristics are apparent in the sample data: - Regime clustering: Values from 2017–2020 sit in a low band (~$14B–$130B), while 2021 onward jumps to a much higher band ($150B–$580B), suggesting a structural regime shift rather than smooth continuous growth — consistent with crypto market cycles (bull/bear phases). - High variance at high X: The spread of Y widens considerably at later time points (e.g., values ranging from ~$186B to ~$580B within similar X ranges in 2023–2026), indicating heteroskedasticity — variance is not constant across the range, which can inflate or dampen the linear r² estimate. - Cyclical/oscillating behavior: Rather than monotonic growth, Y rises and falls in waves that loosely track X, consistent with boom-bust crypto cycles (e.g., 2021 peak, 2022 decline, 2024–2025 resurgence).
4. Confounding Factors and Caveats
Several caveats limit strong causal interpretation: - Metadata inconsistency: The X-axis label references Ethereum market cap while its dataset description cites Bitcoin OHLCV, and the Y-axis similarly cross-references mismatched sources. This suggests a data-merging or labeling error that should be resolved before drawing firm conclusions about which variables are actually being compared. - Shared temporal trend: Since X is fundamentally a timestamp/time-indexed variable, much of the "correlation" may reflect a common macro trend (overall crypto market growth) rather than a direct causal or economic relationship — classic spurious correlation risk in time series. - Non-stationarity: Both crypto prices and market caps are highly non-stationary (trending, volatile) series; Granger causality tests assume stationarity, so results may be biased unless the data were differenced or detrended. - Market co-movement: BTC and ETH prices are known to be highly correlated due to shared market sentiment, liquidity flows, and correlated speculative demand — this "confound" likely accounts for much of the observed relationship regardless of any fundamental causal link.
5. Actionable Insights and Further Investigation
To strengthen this analysis: (1) verify and correct the axis/column labeling to ensure the comparison is between the intended variables (e.g., BTC price vs. ETH market cap, not accidental timestamp fields); (2) test stationarity (ADF/KPSS tests) and consider differencing or log-transforming both series before rerunning correlation and Granger tests, since raw price/cap series are typically non-stationary; (3) segment the analysis by market regime (bull vs. bear years) to see if the relationship strength changes across cycles; and (4) given the modest Granger causality result, consider testing additional lags and including control variables (e.g., overall crypto market cap, BTC dominance, or macro liquidity indices) to rule out confounding from shared market-wide trends before treating this as evidence of a genuine predictive/causal relationship.
X dataset: CryptoDataDownload – Binance BTC/USDT Daily OHLCV
Y dataset: Ethereum Historical Data (Daily)
Part of experiment: Bitcoin - CryptoDataDownload – Binance BTC/USDT Daily OHLCV vs Ethereum Historical Data (Daily)