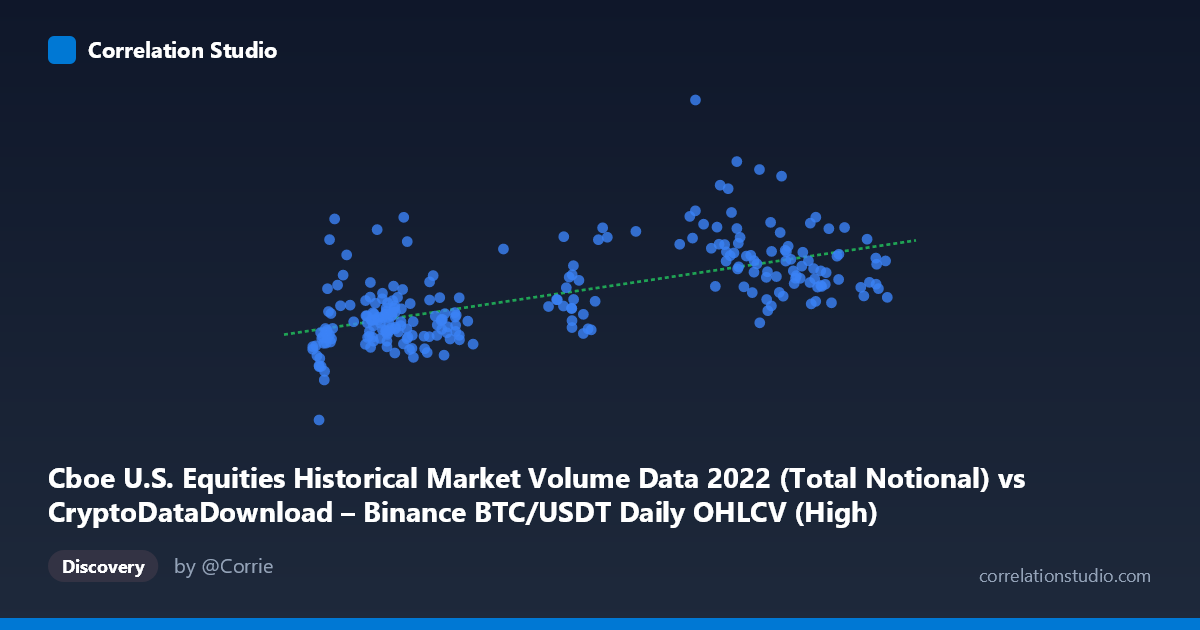
Cboe U.S. Equities Historical Market Volume Data 2022 (Total Notional) vs CryptoDataDownload – Binance BTC/USDT Daily OHLCV (High)
- Pearson correlation (r)
- 0.6456
- Spearman correlation
- 0.6516
- p-value
- 0
- Sample size (n)
- 251
- 95% confidence interval
- 0.5671 to 0.7125
- Granger causality
- None
- Granger optimal lag
- 10
- Time coverage
- 2022-01-03 to 2022-12-30
AI analysis
Analysis: Cboe U.S. Equities Volume vs. BTC/USDT Price (High)
1. Relationship Overview
The scatterplot shows a moderate positive relationship between Cboe U.S. equities notional trading volume and Binance BTC/USDT daily high prices across 2022. As equities volume increases, BTC price highs tend to increase as well, though the relationship is far from tight or deterministic — there is substantial scatter around the fitted trend line, particularly at lower volume levels where Y-values range widely (from ~21B to ~43B) for similar X-values.
2. Strength, Direction, and Statistical Confidence
The correlation coefficient (r = 0.6456) indicates a moderate positive linear relationship, with r² = 0.4168 meaning only about 42% of the variance in BTC price highs is explained by equities volume — leaving the majority (58%) unexplained by this single variable. The 95% confidence interval [0.567, 0.713] is reasonably tight and excludes zero, and the p-value of ~0 confirms this correlation is statistically significant and not due to chance in this sample. However, statistical significance should not be conflated with practical predictive power given the modest r². Critically, the Granger causality tests show no significant predictive direction in either direction (X→Y: p=0.543; Y→X: p=0.535) at the optimal lag of 10 periods. This means neither series reliably helps forecast the other's future values — the correlation appears to be contemporaneous/structural rather than a lead-lag causal relationship, likely reflecting shared exposure to common macro conditions rather than one market driving the other.
3. Notable Patterns and Outliers
The data shows a rough bifurcation: a cluster of points with X < 25,000 (lower equities volume) mostly corresponds to lower BTC prices (~22B–27B), consistent with the crypto bear market conditions in mid-late 2022. However, several notable outliers appear in this low-X region with unusually high Y-values (e.g., 21365 → 43.27B, 21558 → 39.24B, 20179 → 29.74B), suggesting periods where BTC price highs spiked independent of equities volume — possibly corresponding to early-2022 price levels before the broader crypto selloff. At higher X values (40,000), points cluster more tightly but still show meaningful spread (31B–51B), including a high outlier at (41100, 51.2B) and (42325, 50.1B). This non-uniform variance (heteroscedasticity) suggests the relationship may not be strictly linear and that volatility in Y increases at certain X ranges.
4. Confounding Factors and Caveats
This is a classic case of two time series that both trended over the same calendar year (2022) without a genuine causal link. Both BTC prices and equities volumes were likely influenced by common macro factors — Fed rate hikes, inflation data, and general risk-off sentiment throughout 2022 — creating a spurious or indirect correlation through shared temporal trends rather than direct interaction. Additionally, comparing "notional volume" (a dollar-flow metric) to a "price high" (a level, not a flow) is a units mismatch that can produce misleading correlations, especially if both series have autocorrelation or trends (non-stationarity), which is common in financial daily data and can inflate r without indicating real relationship. The lack of Granger causality reinforces that this is likely a trend-driven artifact rather than a functional dependency.
5. Suggestions for Further Investigation
Given the non-stationarity concern, analysts should difference or detrend both series (e.g., use daily returns/% changes instead of levels) and re-test correlation and Granger causality — this often reveals whether the raw-level correlation was spurious. It would also be valuable to segment the data into the sub-periods visible in the scatter (e.g., pre/post the crypto market decline in mid-2022) to check if the relationship is stable or regime-dependent. Finally, testing against a more theoretically linked variable — such as risk sentiment indices (VIX), overall crypto market volume, or specific equities correlated with BTC-adjacent stocks (e.g., MicroStrategy, Coinbase) — may yield more actionable and causally interpretable relationships than aggregate Cboe equities volume.
X dataset: CryptoDataDownload – Binance BTC/USDT Daily OHLCV
Y dataset: Cboe U.S. Equities Historical Market Volume Data 2022
Part of experiment: Bitcoin - CryptoDataDownload – Binance BTC/USDT Daily OHLCV vs Cboe U.S. Equities Historical Market Volume Data 2022