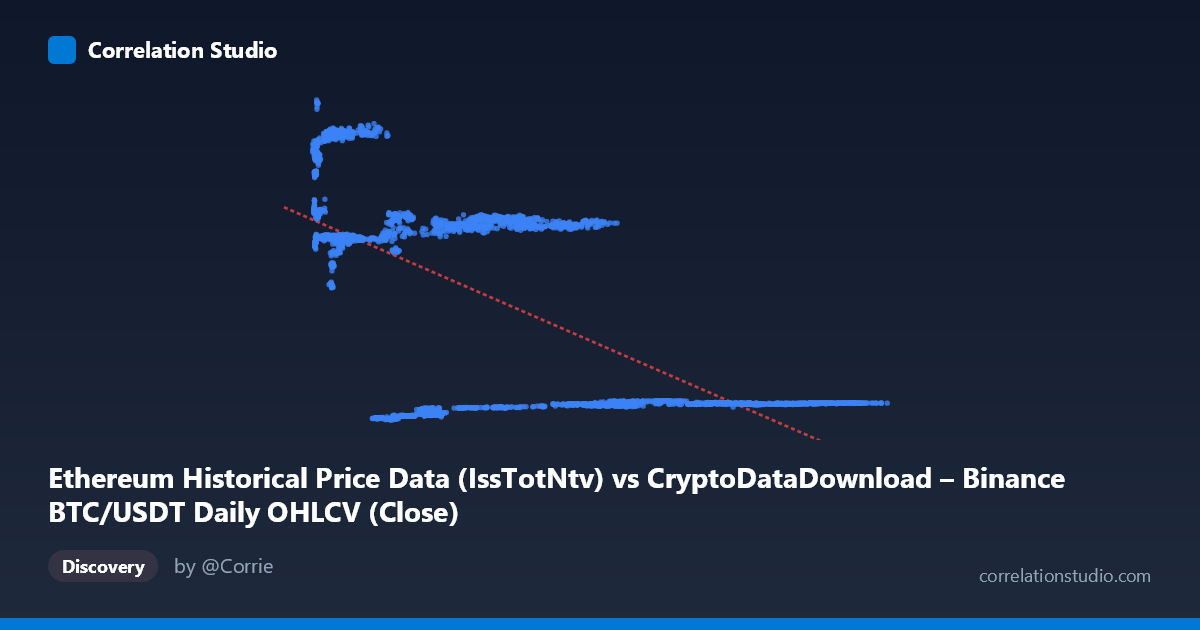
Ethereum Historical Price Data (IssTotNtv) vs CryptoDataDownload – Binance BTC/USDT Daily OHLCV (Close)
- Pearson correlation (r)
- -0.6407
- Spearman correlation
- -0.4728
- p-value
- 0
- Sample size (n)
- 3191
- 95% confidence interval
- -0.6607 to -0.6198
- Granger causality
- Y → X
- Granger optimal lag
- 10
AI analysis
Analysis: BTC/USDT Price vs. Ethereum Metric Relationship
1. What the Visualization Reveals
The scatterplot displays a clear negative, moderately strong relationship between the X variable (labeled as Ethereum "IssTotNtv" but populated with values in the tens of thousands, consistent with BTC/USDT price data) and Y (labeled as BTC/USDT Close price). The data does not form a single tight line but rather appears to cluster into distinct bands — notably a low-X/high-Y cluster (~4,000–13,000 X paired with ~13,000–21,000 Y), a mid-range cluster (~24,000–58,000 X paired with ~13,000–15,000 Y), and a high-X/low-Y cluster (~60,000–110,000 X paired with ~2,000–2,800 Y). This banding suggests the relationship may be driven by distinct regimes or time periods rather than a smooth continuous decline.
2. Strength, Direction, and Statistical Confidence
The correlation coefficient (r = -0.64) indicates a moderate-to-strong inverse relationship, with r² = 0.41 meaning that roughly 41% of the variance in Y is statistically explained by X — leaving the majority (59%) unexplained by this linear model alone. The 95% confidence interval [-0.66, -0.62] is tight, and the p-value of ~0 confirms this correlation is highly statistically significant and not due to chance, especially given the large sample size (n=3,191). However, statistical significance should not be conflated with strong predictive power — 41% variance explained leaves substantial room for other factors. The Granger causality results are particularly noteworthy: they indicate Y Granger-causes X (not the reverse), with F=1.87, p=0.045 at a 10-period lag, while X shows no significant predictive power over Y (p=0.77). This suggests that historical Y values contain modest but statistically meaningful information for forecasting future X values — the opposite temporal direction one might naively assume from axis labels.
3. Notable Patterns and Anomalies
The clustering pattern is the most striking feature: rather than a continuous scatter, the data separates into at least three visually distinct groups, each with tight internal Y-ranges. This strongly suggests temporal regime-switching — likely different market cycles, halving periods, or bull/bear phases in cryptocurrency markets — rather than a stable, continuous functional relationship between the two variables. Within each cluster, the X-Y relationship appears nearly flat or only weakly related, meaning the overall negative correlation may be substantially driven by between-cluster (i.e., between-era) differences rather than a consistent within-regime relationship. This is a classic case where aggregate correlation can be misleading (related to Simpson's paradox).
4. Confounding Factors and Caveats
The variable labeling itself is a red flag: X is nominally "Ethereum IssTotNtv" but the described range (3,189–124,658) and dataset title reference BTC/USDT OHLCV, suggesting possible metadata mismatch or mislabeling that should be verified before drawing conclusions. Additionally, both series span 2017–2026, a period encompassing multiple crypto bull/bear cycles, COVID-era volatility, and regulatory shifts — all of which act as omitted confounders driving both series simultaneously (common trend/seasonality rather than direct causation). Cryptocurrency prices are also highly autocorrelated and non-stationary, which can artificially inflate both correlation and Granger causality statistics if not properly differenced or detrended.
5. Recommendations for Further Investigation
Before acting on this relationship, (1) verify and correct the axis/column labeling to ensure X and Y represent the intended metrics; (2) test the correlation within each visually identified cluster/regime separately to see if the relationship holds locally or is purely an artifact of regime-switching; (3) re-run Granger causality on stationarity-adjusted (differenced or log-returned) series, since raw price-level Granger tests are prone to spurious results; and (4) incorporate a time-based color gradient in the scatterplot to visually confirm whether clusters correspond to specific date ranges, which would strongly support a regime-based rather than causal interpretation.
X dataset: CryptoDataDownload – Binance BTC/USDT Daily OHLCV
Y dataset: Ethereum Historical Price Data
Part of experiment: Bitcoin - CryptoDataDownload – Binance BTC/USDT Daily OHLCV vs Ethereum Historical Price Data