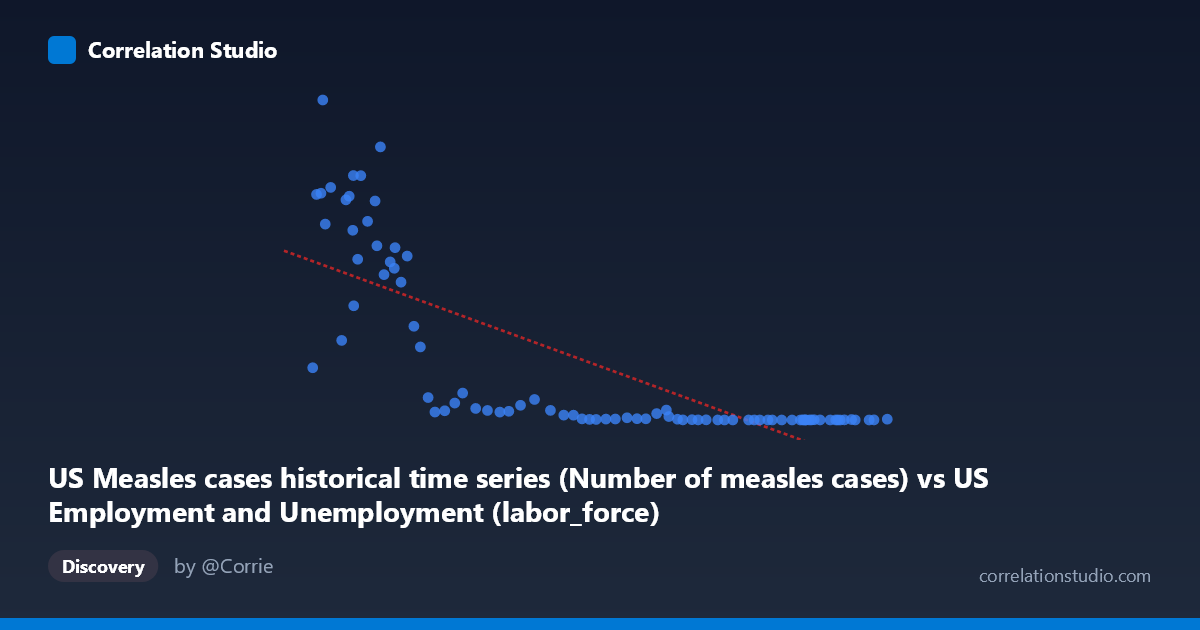
US Measles cases historical time series (Number of measles cases) vs US Employment and Unemployment (labor_force)
- Pearson correlation (r)
- -0.7719
- Spearman correlation
- -0.911
- p-value
- 0
- Sample size (n)
- 85
- 95% confidence interval
- -0.8459 to -0.6688
- Granger causality
- None
- Granger optimal lag
- 10
- Time coverage
- 1941-01-01 to 2025-01-01
- Recomputed on refreshed data
- 2026-10-18 (r was -0.7719)
AI analysis
Analysis: US Measles Cases vs. US Labor Force Size (1941–2025)
1. What the Visualization Reveals
The scatterplot displays a striking negative relationship between annual US measles case counts (X-axis) and the US labor force size (Y-axis) across roughly eight decades. As measles cases decrease — trending from historically high counts toward near-elimination — the labor force grows substantially. The data points form a sweeping, curved arc rather than a tight linear band, with extreme Y-values (labor force in the hundreds of thousands) clustered at low X-values (few measles cases), and moderate Y-values concentrated at higher X-values. This visual shape immediately signals that a simple linear model, while statistically meaningful, does not fully capture the underlying structure of the relationship.
2. Correlation Strength, Direction, and Causality
The Pearson correlation of r = -0.772 indicates a strong negative association, and the R² of 0.596 means that approximately 59.6% of the variance in labor force size is statistically "explained" by variation in measles case counts within this linear framework. The 95% confidence interval of [-0.846, -0.669] is entirely negative and relatively narrow given the sample size (n = 85), and the p-value of effectively zero confirms this is not a chance finding. However, the note that Spearman ρ exceeds Pearson r is important: it suggests the true relationship is better described by a monotonic but non-linear function (likely logarithmic or power-law), meaning the linear R² of 59.6% likely understates the actual predictive association. Critically, Granger causality tests found no significant directional predictability in either direction (X→Y: F = 1.51, p = 0.161; Y→X: F = 1.47, p = 0.178), meaning neither variable temporally predicts the other after accounting for their own histories. This is a decisive finding: the correlation reflects a shared time trend, not a causal mechanism.
3. Notable Patterns, Clusters, and Outliers
Several structural features stand out in the data: - High-measles / lower-labor-force cluster: Points like (55,910; 894,134) and (67,639; 763,094) represent early decades with massive measles outbreaks and a smaller workforce — these anchor the upper-left of the plot and exert high leverage on the regression line. - Low-measles / higher-labor-force cluster: The dense cluster of points near X = 140,000–170,000 with Y values mostly below 1,000 represents the post-vaccination era, where measles was nearly eliminated and the labor force had grown enormously. - The point (53,860; 146,013) is a notable outlier — relatively few measles cases but a very low labor force, likely representing an early transitional year. - Extreme heteroscedasticity: Variance in Y is dramatically larger at low X values, which further confirms that a logarithmic or exponential decay model would fit far better than a linear one.
4. Confounding Factors and Critical Caveats
The most important caveat is that both variables are driven primarily by calendar time — this is a classic case of spurious correlation through shared secular trends. Measles cases declined due to the introduction of the measles vaccine in 1963 and subsequent immunization programs. The labor force grew due to population growth, the post-WWII baby boom entering working age, and increased female labor force participation — none of which are causally connected to measles vaccination rates. Additional confounders include: - Population size underlies both variables (more people → larger labor force; more people historically → more measles cases); - Socioeconomic development correlates with both improved public health outcomes and labor market expansion; - The Granger causality null result statistically reinforces that no temporal lead-lag relationship exists, further disqualifying causal interpretation. The linear regression equation (y = -5.02x + 714,015) should therefore be treated as a descriptive summary of a time-coincident trend, not a predictive or causal model.
5. Actionable Insights and Further Investigation
- Detrend both series by regressing each against year (or population size) and analyze the residuals — this would reveal whether any genuine relationship exists beyond shared time trends. - Fit a logarithmic or power-law model (given the Spearman Pearson signal and visible curvature), which would likely improve explained variance substantially and reduce heteroscedasticity. - Normalize both variables by population (cases per 100,000; labor force participation rate) to remove the confounding effect of raw population growth, which may collapse the apparent correlation significantly. - Introduce vaccine coverage rates as a mediating variable to test whether the measles decline pathway operates independently of labor force dynamics. - Consider structural break analysis around 1963 (vaccine introduction) and 2000 (measles elimination declaration) to test whether the relationship is stable across eras or is entirely an artifact of the pre/post-vaccination transition.
X dataset: US Employment and Unemployment
Y dataset: US Measles cases historical time series
Part of experiment: Yearly - US Employment and Unemployment vs US Measles cases historical time series