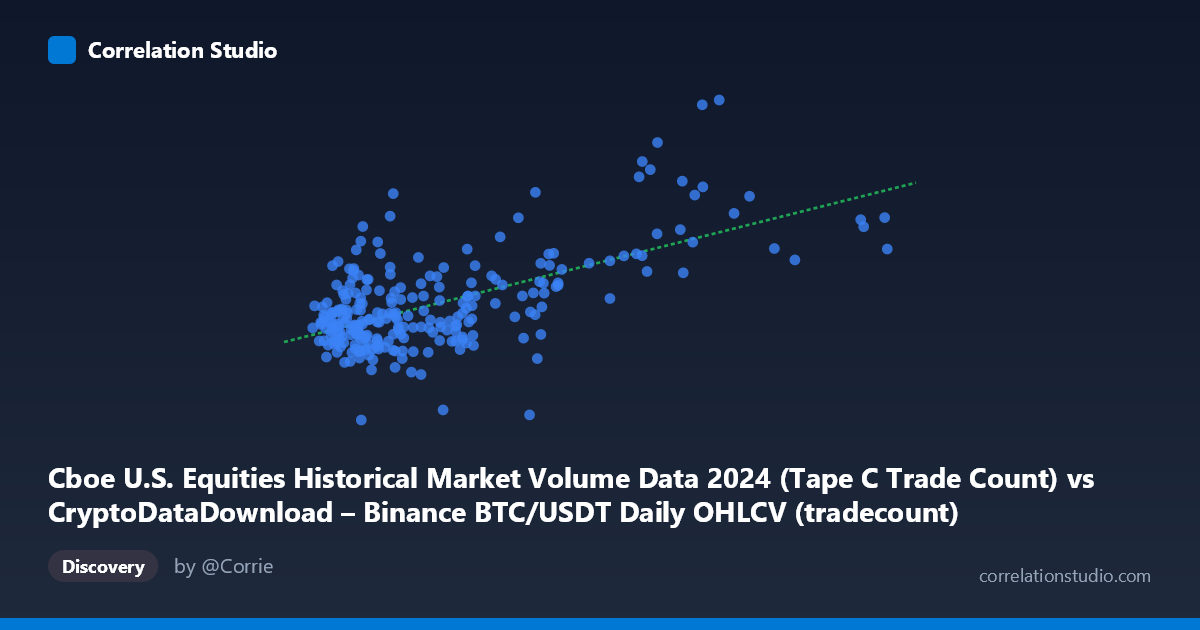
Cboe U.S. Equities Historical Market Volume Data 2024 (Tape C Trade Count) vs CryptoDataDownload – Binance BTC/USDT Daily OHLCV (tradecount)
- Pearson correlation (r)
- 0.6199
- Spearman correlation
- 0.427
- p-value
- 0
- Sample size (n)
- 252
- 95% confidence interval
- 0.5375 to 0.6906
- Granger causality
- None
- Granger optimal lag
- 10
- Time coverage
- 2024-01-02 to 2024-12-31
AI analysis
Analysis of Cboe Tape C Trade Count vs. Binance BTC/USDT Tradecount
1. Overall Relationship The scatterplot displays a moderate positive relationship between daily Cboe equities trade counts (X) and Binance BTC/USDT tradecount (Y). The bulk of observations cluster tightly in the lower-left region (X roughly 900K–3M, Y roughly 1.6M–2.1M), with a sparser but clearly upward-trending tail of higher-X observations extending out to ~12M. This tail is what visually anchors the positive slope — without it, the dense cluster alone shows much weaker structure.
2. Strength, Direction, and Statistical Confidence The correlation coefficient (r = 0.62) indicates a moderate-to-strong positive linear association, with r² = 0.384 meaning only about 38% of the variance in Binance trade activity is statistically explained by Cboe equities trade counts — leaving the majority (62%) attributable to other factors. The 95% CI [0.538, 0.691] is reasonably tight and excludes zero, and the p-value ≈ 0 confirms this correlation is highly unlikely to be due to chance at n=252. However, correlation here should not be read as causation or even reliable predictive linkage: the Granger causality tests show no significant predictive direction in either direction (X→Y: p=0.863; Y→X: p=0.883), even at an optimal lag of 10 periods. This is an important caveat — the two series move together in level/scale but do not help forecast one another's future values, suggesting the relationship is contemporaneous/structural (e.g., both trending with overall 2024 market activity growth) rather than one series driving the other.
3. Notable Patterns and Outliers The data is not homogeneous — there appear to be at least two regimes: a dense low-X cluster (the majority of days) and a smaller set of high-X days (X 5M, up to 12M) with correspondingly elevated Y values (2,000K–2,800K). Points like (8250511, 2247962), (9048605, 2407797), and (12012364-range extreme) pull the regression line's slope upward disproportionately given their leverage as high-X outliers. Within the dense cluster itself, the relationship looks weak/noisy — Y ranges widely (1.6M–2.4M) for a narrow X band, suggesting the moderate r² is substantially driven by these few high-leverage points rather than a uniform linear trend across the whole range.
4. Confounding Factors and Caveats Both series are daily 2024 trading metrics likely influenced by common macro drivers: overall market volatility events, holidays/weekends (both equities and crypto markets have reduced but non-identical trading calendars), and broad "risk-on" sentiment days that boost trading volume across asset classes simultaneously. This shared exposure to market-wide volume surges (e.g., during major news events) could inflate the correlation without implying any direct mechanistic link between Cboe equities and Binance BTC activity. Additionally, using trade count rather than volume or notional value mixes microstructure effects (e.g., algorithmic order splitting) that may differ structurally between equities and crypto markets, and the leverage from a handful of extreme-X points warrants caution regarding robustness.
5. Suggestions for Further Investigation Given the lack of Granger causality, treat this as a contemporaneous co-movement rather than a predictive signal — it's not actionable for lead-lag trading strategies. To refine the analysis: (a) run the regression with and without the high-leverage tail (X 5M) to check if r²/slope is stable or an artifact of few points; (b) test log-transformed variables, since trade counts are often right-skewed and a log-log fit may reveal a cleaner power-law relationship; (c) control for known common factors (day-of-week, major market events, overall volatility indices like VIX) via partial correlation or multivariate regression to isolate any residual direct linkage; and (d) extend the Granger test with exogenous market-wide volume/volatility as a control variable to check if the moderate r² collapses once shared macro drivers are accounted for.
X dataset: CryptoDataDownload – Binance BTC/USDT Daily OHLCV
Y dataset: Cboe U.S. Equities Historical Market Volume Data 2024
Part of experiment: Bitcoin - CryptoDataDownload – Binance BTC/USDT Daily OHLCV vs Cboe U.S. Equities Historical Market Volume Data 2024