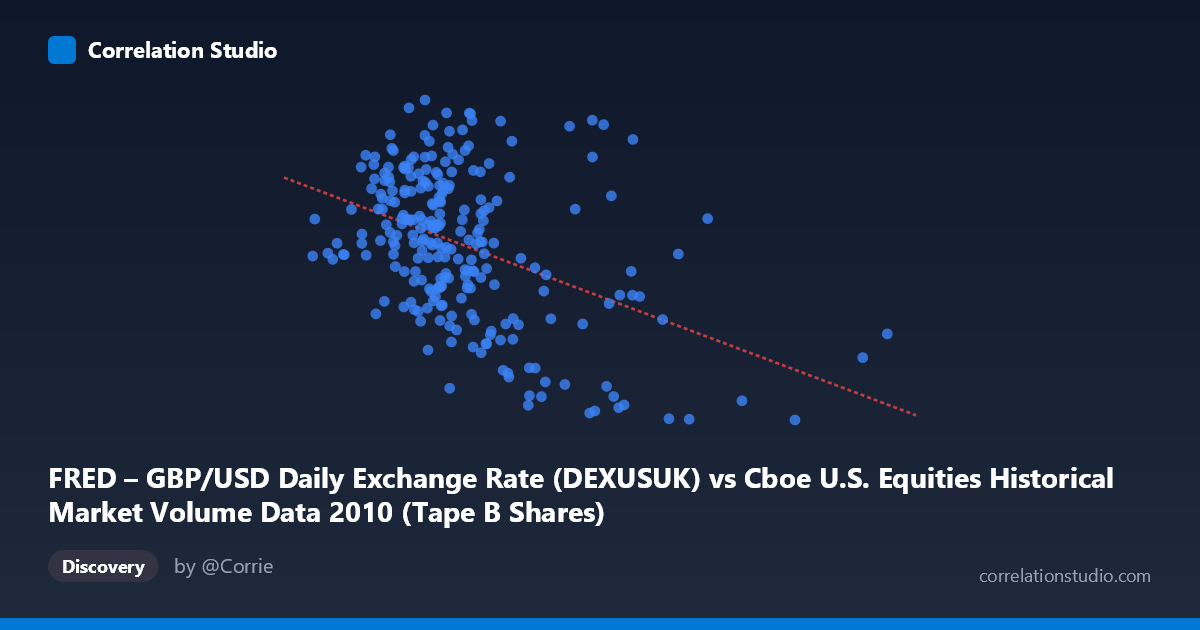
FRED – GBP/USD Daily Exchange Rate (DEXUSUK) vs Cboe U.S. Equities Historical Market Volume Data 2010 (Tape B Shares)
- Pearson correlation (r)
- -0.4299
- Spearman correlation
- -0.3792
- p-value
- 0
- Sample size (n)
- 249
- 95% confidence interval
- -0.5261 to -0.3228
- Granger causality
- None
- Granger optimal lag
- 1
AI analysis
Scatterplot Analysis: Cboe Market Volume vs. GBP/USD Exchange Rate (2010)
Relationship Overview
The scatterplot reveals a modest negative relationship between U.S. equity market trading volume (Cboe, Tape B shares) and the GBP/USD exchange rate across 2010. As daily trading volume increases, the pound sterling tends to trade at a slightly lower value against the dollar. The linear regression equation (y = -4.7007E-10x + 1.599) captures this downward slope, but the scatter around the regression line is visually considerable, suggesting the relationship is real but far from deterministic. The data cloud spans a wide volume range (~37.5M to ~328.6M), while the exchange rate remains relatively compressed between approximately 1.43 and 1.64 — a range of just ~21 cents — which itself limits the practical magnitude of any relationship.
Correlation Strength and Statistical Significance
The Pearson correlation of r = -0.43 indicates a weak-to-moderate negative association. Critically, r² = 0.185, meaning trading volume explains only ~18.5% of the variance in the GBP/USD rate — the remaining ~81.5% is driven by other factors entirely. The 95% confidence interval of [-0.526, -0.323] is meaningfully negative throughout, confirming the direction is reliable, and the p-value of 1.27 × 10⁻¹² establishes high statistical significance given n = 249 paired observations drawn from a population of 3,302 trading days. However, statistical significance here is partly a function of sample size and should not be conflated with practical or economic significance. The Granger causality results are telling: neither direction (X→Y nor Y→X) reaches significance at conventional thresholds (F = 0.56, p = 0.46 for volume predicting GBP/USD; F = 2.47, p = 0.12 for GBP/USD predicting volume). This means neither variable temporally predicts the other — the observed correlation is contemporaneous rather than directional, undermining any causal narrative.
Patterns, Clusters, and Outliers
Several notable features are visible in the data. The bulk of observations cluster in the 70M–150M volume range with exchange rates between 1.48 and 1.62, forming a relatively dense core. There is a sparse but visible group of high-volume outliers (175M shares, including points reaching ~328M) that consistently appear at the lower end of the GBP/USD range (~1.43–1.56), which disproportionately drives the negative slope. A few points at very low volumes (~37M–54M) show mid-range exchange rates (~1.54), suggesting the relationship may weaken or reverse at the extremes. The relationship also appears somewhat heteroscedastic — variance in the exchange rate seems slightly wider at moderate volume levels than at the extremes — and a non-linear (perhaps quadratic or threshold) fit might capture the data structure marginally better than a pure linear model.
Confounding Factors and Caveats
Several important caveats apply. First, temporal confounding is the most significant concern: both variables evolve over calendar time in 2010, and shared macro trends (e.g., post-financial-crisis risk appetite, Federal Reserve policy, European sovereign debt concerns weakening the pound) could simultaneously drive higher U.S. equity volumes and a weaker pound, creating a spurious correlation. Second, the note that axes appear swapped in the dataset descriptions (FRED GBP/USD is on X but described as Y-axis column, and vice versa) warrants verification before drawing conclusions. Third, Tape B specifically represents a subset of U.S. equities (NYSE American/regional exchanges), not total market volume, which may introduce idiosyncratic noise. Finally, the compressed Y-axis range (1.43–1.64) means even statistically detectable correlations translate to economically tiny exchange rate movements per unit volume change.
Actionable Insights and Further Investigation
Given the absence of Granger causality and modest r², this correlation is best treated as a coincident macro signal rather than a predictive trading relationship. Recommended next steps include: (1) controlling for calendar time explicitly by adding date as a covariate or examining residuals after detrending both series; (2) testing whether high-volume days correspond to specific macro events (e.g., FOMC announcements, UK economic releases) that jointly move both variables; (3) expanding to total Cboe volume or consolidated U.S. market volume rather than Tape B alone to reduce noise; (4) applying a rolling correlation analysis to determine whether the relationship strengthens during specific sub-periods of 2010 (e.g., the May Flash Crash period); and (5) incorporating additional forex pairs or VIX data to test whether the relationship proxies for broader risk-off/risk-on dynamics rather than a direct volume-sterling linkage.
X dataset: Cboe U.S. Equities Historical Market Volume Data 2010
Y dataset: FRED – GBP/USD Daily Exchange Rate
Part of experiment: Daily - Cboe U.S. Equities Historical Market Volume Data 2010 vs FRED – GBP/USD Daily Exchange Rate