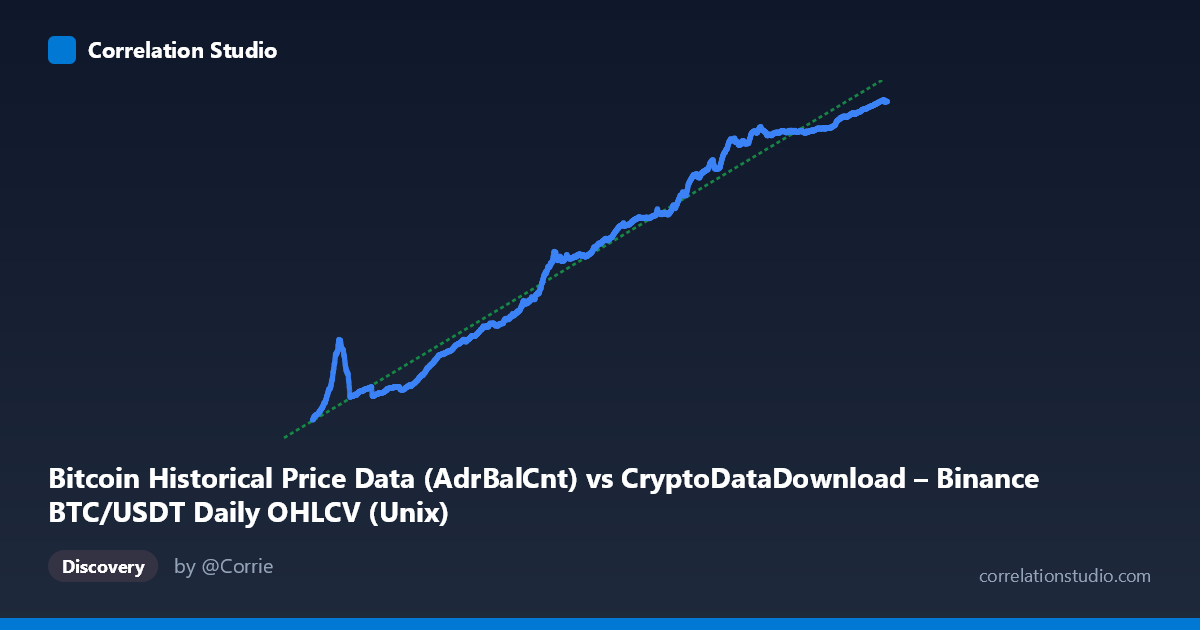
Bitcoin Historical Price Data (AdrBalCnt) vs CryptoDataDownload – Binance BTC/USDT Daily OHLCV (Unix)
- Pearson correlation (r)
- 0.9877
- Spearman correlation
- 0.992
- p-value
- 0
- Sample size (n)
- 3191
- 95% confidence interval
- 0.9868 to 0.9885
- Granger causality
- None
- Granger optimal lag
- 10
AI analysis
Analysis of Bitcoin Timestamp–Value Relationship
1. Overview of the Relationship
The scatterplot shows an extremely tight, monotonically increasing relationship between the X variable (labeled as a timestamp/date field, spanning 2017–2026) and Y (also timestamp-scaled, ranging ~18.8M to ~57M). Given that X is effectively a time index (Unix milliseconds) and Y climbs steadily from ~19M to ~57M over the same period, this is best understood as two variables that both trend strongly with time rather than a direct causal pairing of independent phenomena. The near-linear upward slope, with mild curvature (slightly steeper in 2020–2021 and again in 2024–2025), suggests two growth trajectories — likely Bitcoin price/adoption metrics — that have both expanded over the observation window.
2. Strength, Direction, and Statistical Confidence
The correlation is very strong and positive (r = 0.988), with r² = 0.976 indicating that 97.6% of the variance in Y is statistically explainable by X in a simple linear model. The 95% CI [0.987, 0.989] is narrow, and p ≈ 0 confirms this relationship is not due to chance given the large sample (n = 3,191). However, the Granger causality tests reveal no significant predictive direction in either direction (X→Y: p = 0.559; Y→X: p = 0.454) at 10 lags. This is a critical caveat: strong contemporaneous correlation does not imply that one variable temporally leads or forecasts the other. Practically, this pattern is classic for two non-stationary trending series — both are likely driven by an underlying common factor (time itself, market growth, adoption curves) rather than one causing the other.
3. Patterns, Clusters, and Non-linear Features
Visually, the data does not scatter uniformly around a single line — instead, it traces a piecewise/curved trajectory with distinguishable "regimes": a slow-growth cluster in 2017–2020 (Y in 19M–30M range), an acceleration phase in 2021 (Y jumping toward 37M–40M), a plateau/consolidation in 2022–2023, and a steep renewed climb from 2023–2026 (Y reaching 48M–57M). These regime shifts likely correspond to Bitcoin's known bull/bear market cycles (2017 peak, 2018–2019 bear, 2020–2021 bull, 2022 crash, 2023–2025 recovery/rally). The sample points show local plateaus (e.g., repeated Y values ~51.8M across different 2024 dates), hinting at price consolidation periods that create horizontal segments within the broader trend — a signature of non-linearity that a single linear r² of 0.976 partially masks.
4. Confounding Factors and Caveats
Since both axes are time-linked (X is literally a timestamp column, and Y likely reflects a cumulative or price-driven metric), the high correlation is substantially an artifact of shared temporal trending rather than a meaningful bivariate relationship between independent economic quantities. This is a common pitfall in time-series correlation: two unrelated monotonic series (or a series and its own time index) will almost always show high r purely from shared drift, especially with irregular sampling of "every 63rd point" potentially smoothing out short-term volatility. Additionally, Bitcoin markets are known for volatility clustering, structural breaks (halving cycles, regulatory events), and regime changes that violate the stationarity assumptions underlying simple linear correlation and Granger tests.
5. Recommendations for Further Investigation
Given the likely spurious/trend-driven nature of this correlation, analysts should: (a) detrend or difference both series (e.g., convert to daily/period returns or growth rates) before re-testing correlation and Granger causality, which would better reveal genuine short-term co-movement; (b) test for cointegration (e.g., Engle-Granger or Johansen tests) rather than relying on levels-based correlation, since both series are non-stationary; (c) segment the analysis by the identified market regimes (2017–2020, 2021, 2022–2023, 2023–2026) to check whether the relationship strength or slope changes across cycles; and (d) clarify the actual metric definitions (the axis labels appear swapped/mislabeled between "AdrBalCnt" and "Unix" — this should be corrected before drawing domain conclusions about price vs. address-balance-count relationships).
X dataset: CryptoDataDownload – Binance BTC/USDT Daily OHLCV
Y dataset: Bitcoin Historical Price Data
Part of experiment: Bitcoin - CryptoDataDownload – Binance BTC/USDT Daily OHLCV vs Bitcoin Historical Price Data