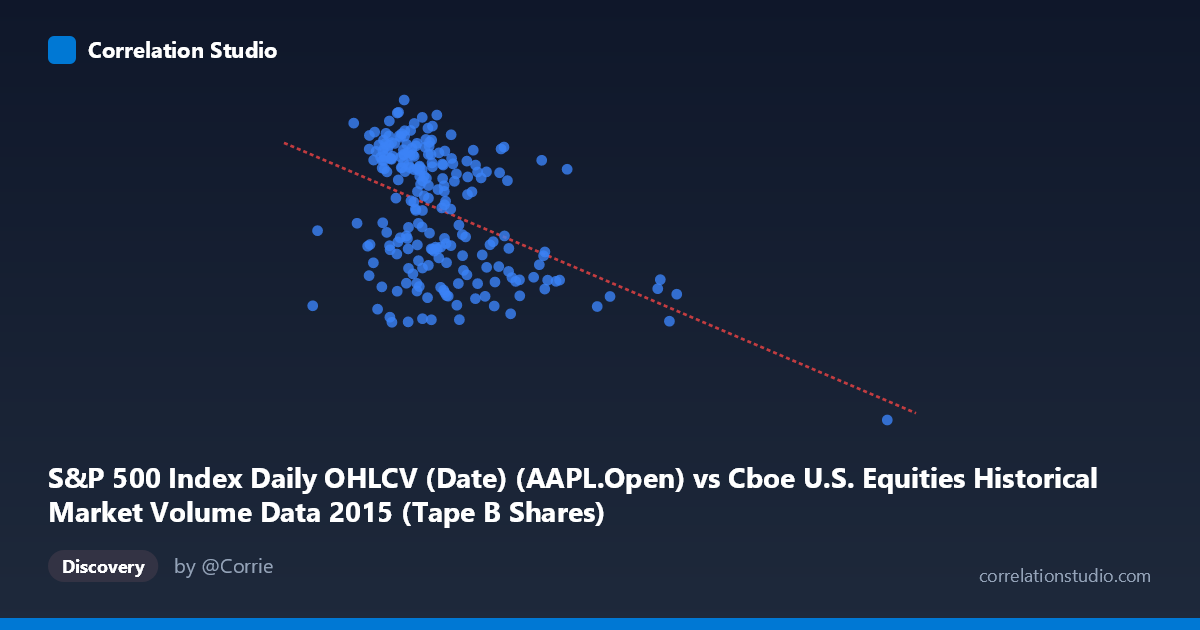
S&P 500 Index Daily OHLCV (Date) (AAPL.Open) vs Cboe U.S. Equities Historical Market Volume Data 2015 (Tape B Shares)
- Pearson correlation (r)
- -0.4487
- Spearman correlation
- -0.4068
- p-value
- 0
- Sample size (n)
- 222
- 95% confidence interval
- -0.548 to -0.3369
- Granger causality
- None
- Granger optimal lag
- 1
AI analysis
Scatterplot Analysis: AAPL Opening Price vs. Cboe Tape B Share Volume (2015)
Relationship Overview The scatterplot reveals a moderate negative relationship between Apple's daily opening price (X-axis) and Cboe Tape B share volume (Y-axis) across 2015. As AAPL's opening price increases, Tape B share volume tends to decrease. The linear regression equation (y = -1.1357×10⁻⁷x + 132.664) quantifies this inverse trend — for every ~$8.8 increase in AAPL's opening price, Tape B volume falls by roughly 1 unit. The data cloud is notably wide with substantial scatter throughout the range, suggesting the relationship, while real, is far from deterministic and influenced by many competing forces in the broader market ecosystem.
Correlation Strength and Statistical Significance The Pearson correlation of r = -0.4487 indicates a moderate negative association, but the more telling figure is r² = 0.2013, meaning AAPL's opening price explains only about 20.1% of the variance in Tape B volume — leaving roughly 80% attributable to other factors. The 95% confidence interval of [-0.548, -0.337] is meaningfully negative throughout, and the p-value of 2.15×10⁻¹² confirms this correlation is highly statistically significant with near-zero probability of being a chance finding given n = 222 paired observations. However, statistical significance should not be conflated with practical magnitude; a 20% explanatory share is modest in financial market contexts. Notably, Granger causality tests find no significant predictive direction in either direction (X→Y: F=0.525, p=0.469; Y→X: F=1.664, p=0.198), meaning neither variable temporally predicts the other at a 1-period lag — the correlation appears contemporaneous and associative rather than mechanistically directional.
Notable Patterns, Clusters, and Outliers The data shows a dense core cluster concentrated roughly between AAPL opening prices of $70M–$135M (in the dataset's unit scale) and Tape B volumes of 108–132, with the bulk of observations anchored in that zone. There is a visible downward-sloping envelope as prices rise above ~$130M, where volume observations drop and compress toward lower values. A prominent outlier exists at approximately x = 312M, y = 94.87 — the rightmost point sitting far outside the main data cloud, with both the highest AAPL price and the lowest Tape B volume recorded, which likely corresponds to a specific high-price, low-liquidity event day and disproportionately influences the regression slope. Additionally, there appear to be two loose sub-clusters: a lower-price, higher-volume group and a higher-price, lower-volume group, hinting at possible regime-like behavior during 2015 (e.g., pre- and post-August 2015 market correction periods).
Confounding Factors and Interpretive Caveats Several important caveats apply. First, the dataset labels appear to be swapped — AAPL opening prices from the S&P 500 OHLCV dataset are plotted on X while Tape B volume from the Cboe dataset is on Y, which is an unusual pairing and may reflect a dataset joining artifact rather than a theoretically motivated hypothesis. Second, AAPL's price trajectory in 2015 (peaking mid-year then declining during the August selloff) would naturally correlate with overall market volume changes, meaning macroeconomic events (China slowdown fears, Fed rate decisions) are a significant confound driving both variables simultaneously. Third, Tape B volume reflects trading in NYSE American (formerly AMEX) and regional exchange-listed securities — not AAPL itself — so the linkage is indirect and mediated through broad market sentiment. Finally, the N=506 population vs. n=222 sample suggests incomplete pairing that could introduce selection bias.
Actionable Insights and Further Investigation Given the lack of Granger causality, practitioners should not use AAPL price levels as a leading indicator for Tape B volume in trading or market-making strategies. However, the contemporaneous negative correlation may reflect a risk-on/risk-off dynamic worth exploring — periods of AAPL price strength may coincide with capital rotating away from smaller-cap Tape B securities. Recommended next steps include: (1) controlling for the August 2015 volatility regime by splitting the sample pre- and post-correction to test whether the correlation is stable or regime-dependent; (2) removing or investigating the extreme outlier at x≈312M to assess its leverage effect on the regression; (3) testing broader market indices (VIX, total market volume) as mediating variables to decompose the shared variance; and (4) extending the Granger causality test to longer lags (2–5 periods) to rule out delayed predictive relationships that a lag-1 test would miss.
X dataset: Cboe U.S. Equities Historical Market Volume Data 2015
Y dataset: S&P 500 Index Daily OHLCV (Date)
Part of experiment: Daily - Cboe U.S. Equities Historical Market Volume Data 2015 vs S&P 500 Index Daily OHLCV (Date)