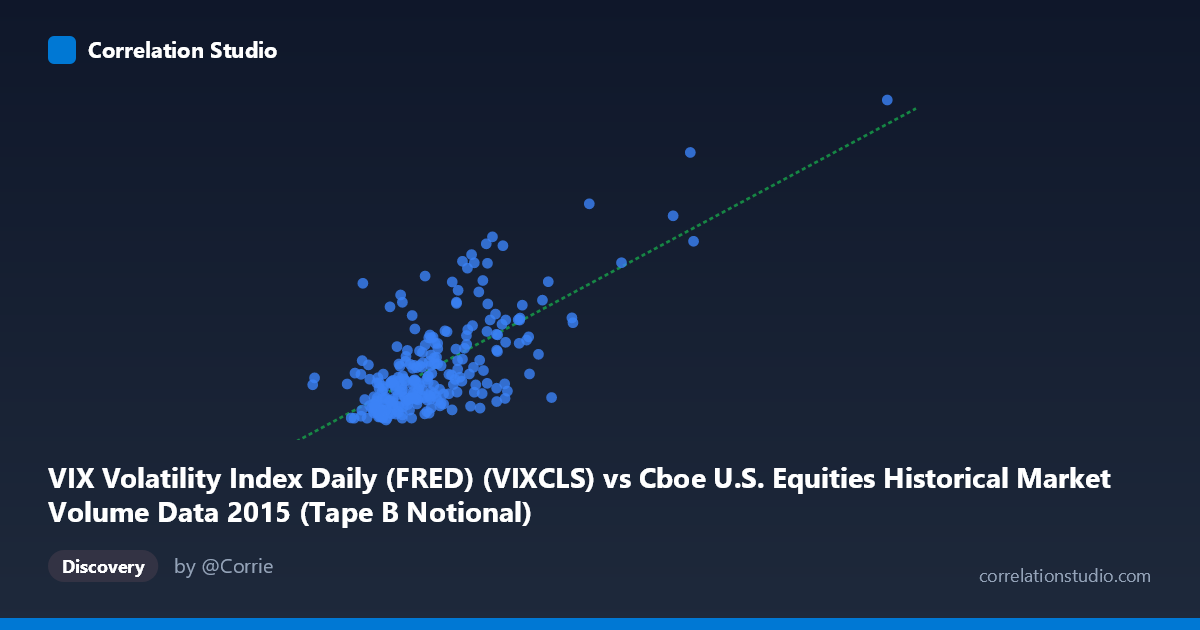
VIX Volatility Index Daily (FRED) (VIXCLS) vs Cboe U.S. Equities Historical Market Volume Data 2015 (Tape B Notional)
- Pearson correlation (r)
- 0.7071
- Spearman correlation
- 0.5903
- p-value
- 0
- Sample size (n)
- 252
- 95% confidence interval
- 0.6394 to 0.7639
- Granger causality
- None
- Granger optimal lag
- 1
AI analysis
Analysis: VIX Volatility Index vs. Tape B Notional Trading Volume (2015)
Relationship Overview
The scatterplot reveals a moderately strong positive relationship between Cboe's Tape B notional trading volume (X-axis) and the VIX Volatility Index (Y-axis) across 252 trading days in 2015. As notional volume increases, VIX tends to rise — a relationship that aligns intuitively with market microstructure theory: heightened fear and uncertainty (elevated VIX) typically drives investors to trade more actively, particularly in mid-cap and regional exchange-listed securities that comprise Tape B. The linear regression equation (y = 1.76154E-09x + 7.06) suggests that for every ~568 billion dollar increase in notional volume, VIX rises by approximately 1 point, though this linear framing likely oversimplifies the underlying dynamics.
Correlation Strength and Statistical Significance
The Pearson correlation of r = 0.707 indicates a moderately strong positive association, and critically, r² = 0.50 means that exactly half of the variance in VIX is explained by Tape B notional volume — a notably high figure for financial time series data, but also a clear reminder that the other 50% of VIX movement is driven by factors entirely outside this model. The 95% confidence interval of [0.639, 0.764] is reassuringly tight, reflecting the robustness of the estimate across a sample of 252 observations drawn from a population of 3,302. The p-value of effectively zero confirms that this correlation is extremely unlikely to be a chance artifact. However, the Granger causality results are striking in their absence: neither direction (volume → VIX nor VIX → volume) achieves statistical significance (X→Y: F=0.017, p=0.896; Y→X: F=0.025, p=0.875). This means that despite the strong contemporaneous correlation, neither variable reliably predicts the other in the next period — suggesting the relationship is largely simultaneous rather than directionally causal, possibly driven by common external shocks.
Patterns, Clusters, and Outliers
Several structural features stand out in the sample points. The bulk of observations cluster in the lower-left region — VIX between 12–18 and notional volume between ~3–6 trillion — representing the relatively calm baseline trading environment that characterized much of early-to-mid 2015. However, there is a clearly visible upper-right cluster of high-leverage points: observations such as (12.58T, 28.03), (12.49T, 36.02), (7.35T, 27.63), and (6.89T, 27.80) sit well outside the main cluster and exert disproportionate influence on the regression line. The point at (12.49T, 36.02) is a notable outlier — likely corresponding to the late August 2015 market correction when the S&P 500 dropped ~11% and VIX spiked to multi-year highs, generating exceptional volume simultaneously. The apparent non-linearity is also worth flagging: the relationship appears to steepen at higher volume levels, suggesting a potentially exponential or threshold-driven dynamic rather than a clean linear one.
Confounding Factors and Caveats
Several important caveats complicate causal interpretation. First, both variables likely respond to the same underlying drivers — macro shocks, geopolitical events, and Federal Reserve policy uncertainty in 2015 (including the first rate hike in nearly a decade) — making the correlation largely a co-movement artifact rather than evidence of a direct mechanism. Second, the dataset covers only one calendar year (2015), which included a specific volatility regime; the relationship could look materially different in low-volatility years like 2017 or crisis years like 2008/2020. Third, Tape B specifically covers NYSE American, NYSE Arca, and regional venues — it is not total market volume, meaning the correlation may be partially driven by ETF arbitrage activity (which concentrates on Tape B venues) that mechanically links volatility to notional flows. Finally, the axis labels appear to be swapped in the dataset metadata (VIX is listed under the Cboe volume dataset and vice versa), which warrants verification before drawing firm conclusions.
Actionable Insights and Further Investigation
Practitioners and researchers should consider several next steps. First, test a non-linear model (log-log or polynomial regression) to better capture the apparent steepening at high volume levels — this could meaningfully improve predictive accuracy over the linear R²=0.50 baseline. Second, given the failed Granger causality tests, intraday data should be explored: simultaneous same-day correlations may mask lead-lag dynamics that only emerge at hourly or sub-hourly frequencies. Third, extending the analysis across multiple years (particularly 2008–2009, 2017, and 2020) would test whether this r=0.707 relationship is stable or regime-dependent. Fourth, controlling for total market volume (Tapes A, B, and C combined) would help isolate whether Tape B specifically carries incremental information beyond aggregate activity. Finally, the strong contemporaneous but non-causal relationship suggests this variable pair could be useful in nowcasting models for volatility regimes, even if unsuitable for directional prediction.
X dataset: Cboe U.S. Equities Historical Market Volume Data 2015
Y dataset: VIX Volatility Index Daily (FRED)
Part of experiment: Daily - Cboe U.S. Equities Historical Market Volume Data 2015 vs VIX Volatility Index Daily (FRED)