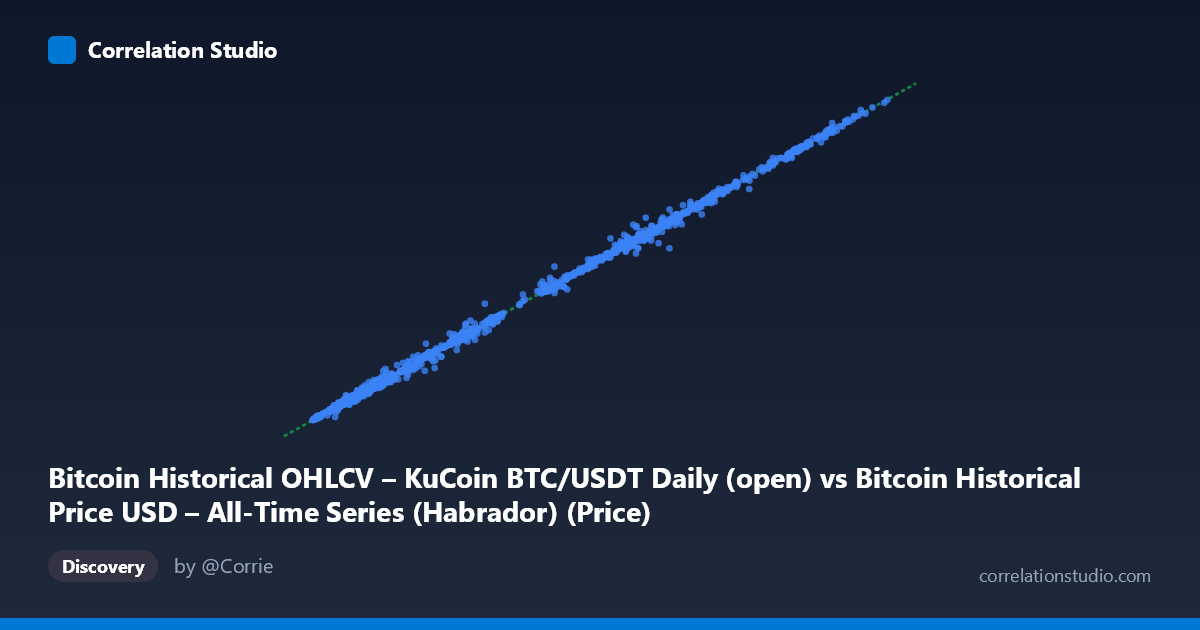
Bitcoin Historical OHLCV – KuCoin BTC/USDT Daily (open) vs Bitcoin Historical Price USD – All-Time Series (Habrador) (Price)
- Pearson correlation (r)
- 0.9995
- Spearman correlation
- 0.9985
- p-value
- 0
- Sample size (n)
- 1861
- 95% confidence interval
- 0.9995 to 0.9996
- Granger causality
- None
- Granger optimal lag
- 10
AI analysis
Analysis: Bitcoin Price Cross-Source Comparison (Habrador Open vs. KuCoin Daily Price)
1. What the Visualization Reveals
This scatterplot compares Bitcoin's opening price from one historical dataset (Habrador) against the daily price from a different source (KuCoin BTC/USDT). The plot shows an almost perfect diagonal line from the origin extending to ~$67,000, with points tightly hugging the 1:1 line (slope ≈ 0.9998, intercept ≈ $3.42). This is not a relationship between two distinct economic variables — it is essentially the same underlying asset price reported by two different sources, with the tight clustering confirming that both datasets are capturing the same historical Bitcoin price trajectory across bull and bear cycles from 2017–2022.
2. Strength, Direction, and Statistical Interpretation
The correlation (r = 0.9995, r² = 0.999) indicates that 99.9% of the variance in one price series is explained by the other — an essentially deterministic relationship rather than a probabilistic one. The 95% CI [0.9995, 0.9996] is extremely narrow given the large sample (n=1,861), and the p-value of 0 confirms this is not due to chance. However, the Granger causality results (p ≈ 0.79–0.80 in both directions) show no meaningful lead-lag predictive relationship — neither series "Granger-causes" the other in a time-series sense. This is expected: these are contemporaneous measurements of the same asset, not causally linked variables. The lack of Granger causality should not be interpreted as decoupling; rather, it confirms that both series move together instantaneously rather than one predicting the other with a lag.
3. Notable Patterns and Outliers
The scatter is remarkably homoscedastic along the entire price range, from ~$3,200 to ~$67,600, with no visible curvature — the linear fit (y = 0.9998x + 3.42) is appropriate across all price regimes (2018 bear market lows through the 2021 all-time-high cycle). A handful of sample points show modest deviations (e.g., 51,503→52,377; 28,936→31,015; 8,187→9,108), suggesting minor day-to-day discrepancies, likely from timing differences (open price vs. daily price/close) or exchange-specific volatility during high-volume trading days. These deviations are proportionally small and don't distort the overall fit.
4. Confounding Factors and Caveats
The near-perfect correlation is expected and somewhat trivial given both variables track the same asset. Key caveats: (1) different exchanges (KuCoin vs. whatever underlies the Habrador dataset) may have slightly different pricing due to liquidity, regional demand, or arbitrage lag; (2) "open" vs. "daily price" definitional differences could explain minor point-level scatter; (3) this is not evidence of a causal economic relationship — it's a data-consistency check. Any inference beyond "these two data sources agree closely" would be inappropriate.
5. Actionable Insights
This analysis is best used as a data validation/reconciliation exercise rather than a discovery of market relationships. Suggested next steps: (a) examine the largest residuals (e.g., points where Y deviates 2% from X) to identify specific dates with data quality issues, exchange outages, or reporting lag; (b) check whether deviations cluster around high-volatility periods (e.g., 2021 bull run) versus quiet periods; (c) if building a unified price series, either source can be used interchangeably, but the minor residual pattern could help flag which source lags during rapid price movements.
X dataset: Bitcoin Historical Price USD – All-Time Series (Habrador)
Y dataset: Bitcoin Historical OHLCV – KuCoin BTC/USDT Daily
Part of experiment: Bitcoin - Bitcoin Historical Price USD – All-Time Series (Habrador) vs Bitcoin Historical OHLCV – KuCoin BTC/USDT Daily