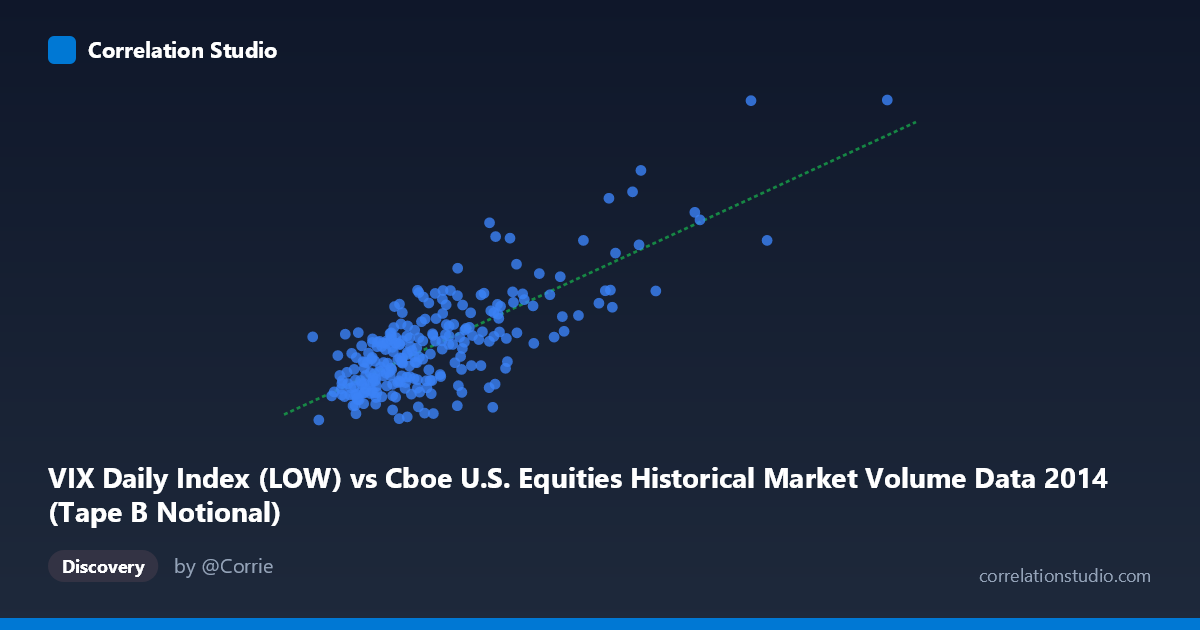
VIX Daily Index (LOW) vs Cboe U.S. Equities Historical Market Volume Data 2014 (Tape B Notional)
- Pearson correlation (r)
- 0.7728
- Spearman correlation
- 0.6438
- p-value
- 0
- Sample size (n)
- 252
- 95% confidence interval
- 0.7178 to 0.8182
- Granger causality
- None
- Granger optimal lag
- 1
AI analysis
Analysis: VIX Daily Index (LOW) vs. Tape B Notional Volume (2014)
Relationship Overview The scatterplot reveals a moderately strong positive relationship between the VIX Daily Index Low values and Tape B Notional trading volume across U.S. equity exchanges in 2014. As the VIX low increases — indicating elevated baseline fear or uncertainty in the market — Tape B notional volume tends to rise correspondingly. This is consistent with well-established market microstructure theory: heightened volatility regimes attract greater trading activity as market participants reposition, hedge, or respond to price dislocations. The linear regression equation (y = 1.096×10⁻⁹x + 8.797) confirms a positive slope, though the extremely small coefficient reflects the vast scale difference between the two variables.
Correlation Strength and Statistical Framing The Pearson correlation of r = 0.773 indicates a strong positive association, and the R² of 0.597 means that roughly 59.7% of the variance in Tape B Notional volume is explained by the VIX Low — a substantial explanatory share for financial market data, though it equally implies ~40% of variance remains unexplained by this variable alone. The 95% confidence interval of [0.718, 0.818] is relatively tight and does not approach zero, reinforcing confidence in the direction and magnitude of the effect. The p-value of effectively 0 (across n = 252 paired observations drawn from a population of N = 3,686) makes it statistically implausible that this correlation arose by chance. However, the Granger causality results are notably inconclusive: neither direction (X→Y: F = 1.33, p = 0.249; Y→X: F = 0.001, p = 0.977) reaches significance at a conventional threshold. This is a critical caveat — while the two variables are strongly correlated contemporaneously, neither demonstrably predicts the other in a temporal lead-lag sense at a one-period lag. The relationship may be driven by common external shocks rather than directional causation.
Notable Patterns, Clusters, and Outliers The sample points reveal a clear cluster of observations concentrated in the lower-left region of the plot — VIX Low values roughly between 2.1B and 5.5B paired with VIX levels of approximately 10–16. This dense cluster reflects the prolonged low-volatility, moderate-volume environment that characterized much of 2014. More striking are the high-leverage outliers in the upper-right quadrant: points such as (10.43B, 24.61) and (9.36B, 19.60) represent episodic volatility spikes — likely corresponding to known market stress events in late 2014 (e.g., geopolitical tensions, oil price collapse, or Federal Reserve communications). These outliers appear to exert disproportionate influence on the regression slope and may inflate the observed r value. There is also a hint of non-linearity: volume appears to accelerate more sharply at higher VIX levels, suggesting a potential exponential or threshold relationship rather than a purely linear one.
Confounding Factors and Interpretive Caveats Several confounds complicate a clean causal interpretation. First, both variables may be jointly driven by macroeconomic news events (e.g., Fed announcements, geopolitical shocks), making their correlation spurious in a causal sense — consistent with the failed Granger tests. Second, Tape B specifically covers NYSE American and regional exchange stocks, which may have idiosyncratic liquidity dynamics not representative of broader market volume. Third, the VIX "Low" (daily intraday low) is a non-standard measure; using the close or open might yield different relationships. Fourth, the data covers only one calendar year (2014), a period of unusual calm punctuated by sharp late-year spikes — results may not generalize to other volatility regimes. Finally, the sample of 252 from a population of 3,686 raises questions about sampling methodology and whether the every-5th-point sample adequately captures tail events.
Actionable Insights and Further Investigation Practitioners should avoid using VIX Low as a standalone predictive signal for Tape B volume given the lack of Granger causality — the contemporaneous correlation does not translate into a reliable forecasting edge at a one-period lag. However, the strong explanatory power (R² ≈ 0.60) suggests VIX Low is a useful control variable in multivariate models of intraday or daily volume. Further investigation should: (1) test non-linear model specifications (log-log or polynomial) given the apparent acceleration at high VIX levels; (2) extend the time series beyond 2014 to test robustness across different volatility regimes; (3) examine longer Granger lags (e.g., 5–10 periods) to determine if predictive relationships emerge over longer horizons; and (4) decompose Tape B volume into trade count vs. average trade size to identify which component drives the VIX sensitivity most strongly.
X dataset: Cboe U.S. Equities Historical Market Volume Data 2014
Y dataset: VIX Daily Index
Part of experiment: Daily - Cboe U.S. Equities Historical Market Volume Data 2014 vs VIX Daily Index