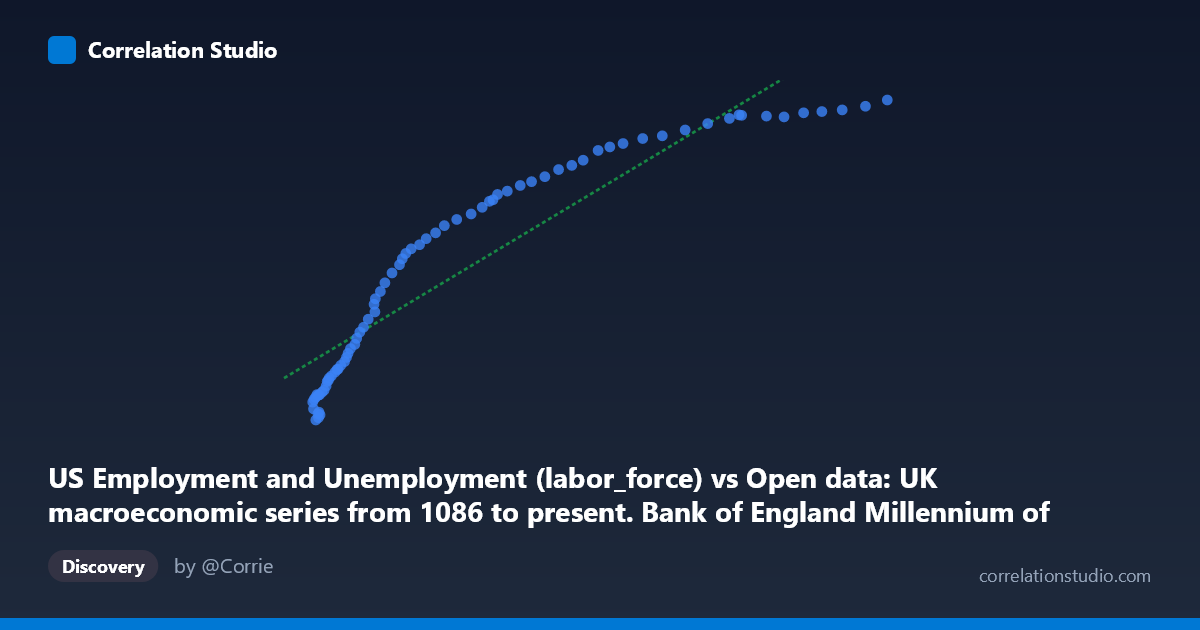
US Employment and Unemployment (labor_force) vs Open data: UK macroeconomic series from 1086 to present. Bank of England Millennium of Macroeconomic Data. (Year) (value)
- Pearson correlation (r)
- 0.9245
- Spearman correlation
- 0.9953
- p-value
- 0
- Sample size (n)
- 76
- 95% confidence interval
- 0.8831 to 0.9516
- Granger causality
- None
- Granger optimal lag
- 10
AI analysis
Scatterplot Analysis: US Labor Force vs. UK Macroeconomic Indicator
Relationship Overview
The scatterplot reveals a strong, positive monotonic relationship between the US labor force size (X-axis) and a UK macroeconomic value — almost certainly a time-indexed variable such as nominal GDP, wages, or a price index given the dataset's description (Bank of England Millennium of Macroeconomic Data). As the US labor force grows from roughly 33,000 to 469,000 (likely in thousands), the UK indicator rises correspondingly from approximately 54,000 to 159,000. The linear regression equation y = 0.2606x + 64,629 captures this upward trend reasonably well, though the relationship shows clear signs of non-linearity, particularly at the upper end of the X-axis where the curve flattens, suggesting diminishing marginal increases in the UK variable as the US labor force expands further.
Correlation Strength and Statistical Significance
The Pearson correlation coefficient of r = 0.9245 indicates a very strong positive association, and the R² of 0.8547 means that approximately 85.5% of the variance in the UK macroeconomic series is statistically explained by variation in the US labor force size. The 95% confidence interval for r of [0.8831, 0.9516] is relatively narrow, reinforcing that this is a robust and precisely estimated correlation rather than a chance result, and the p-value of essentially zero confirms it is highly statistically significant across the 76 paired observations spanning 1941–2016. However, Granger causality tests tell a very different story: neither direction of temporal predictive causality is statistically significant (X→Y: F = 1.01, p = 0.449; Y→X: F = 1.03, p = 0.437) at the optimal lag of 10 periods. This means that despite the impressive correlation, neither variable reliably predicts the other in a lead-lag framework — a crucial caveat against any causal interpretation.
Notable Patterns, Clusters, and Non-Linearity
Several structural features are visible in the data. First, there is a dense cluster of points in the lower-left region (X: 33,000–120,000; Y: 54,000–115,000), where many observations are tightly packed and the relationship appears steeper and more linear. As X increases beyond ~150,000, the data points spread more sparsely and the Y values appear to plateau — growing more slowly relative to X — producing a concave, logarithmic-like curve rather than a purely linear one. This suggests the linear model, while explaining 85.5% of variance, may be systematically underfitting the curvature. A few high-leverage points at the far right (e.g., X ≈ 452,000–469,000, Y ≈ 155,000–159,000) sit near but slightly below what a strict linear extrapolation would predict, consistent with the flattening pattern. No extreme outliers that dramatically break the overall trend are apparent, though the point near (37,674, 54,630) sits somewhat low relative to neighboring X values.
Confounding Factors and Caveats
The most important caveat here is that both variables are almost certainly driven by a common underlying factor: time. The dataset spans 1941–2016, a period during which both the US labor force and virtually any nominal UK macroeconomic series (GDP, wages, price levels) grew substantially and relatively continuously. This means the high correlation is highly likely to be a spurious time-trend correlation — two independently growing time series will naturally correlate strongly without any meaningful economic linkage between them. The Granger causality results strongly support this interpretation: once temporal structure is accounted for, there is no predictive relationship in either direction. Additionally, structural breaks (WWII, oil shocks, the 2008 financial crisis, UK-specific policy changes) affect both series independently and may be creating artificial co-movement. The mismatch in dataset origins (US BLS employment data vs. UK macroeconomic series) further undermines any direct causal narrative.
Actionable Insights and Further Investigation
Given the strong suspicion of spurious correlation driven by shared time trends, the most important next step is to detrend both series — for example, by analyzing year-over-year growth rates or first differences rather than levels — and re-examine the correlation. Researchers should also consider cointegration testing (e.g., Engle-Granger or Johansen), which is more appropriate than simple Granger causality for long-run relationships between potentially non-stationary time series. It would be valuable to identify precisely which UK macroeconomic variable is on the Y-axis, as nominal price or wage indices would be expected to grow monotonically regardless of US conditions. If a genuine research question about US-UK economic linkages is motivating this analysis, more targeted approaches — such as examining trade flows, financial market integration, or synchronized business cycle indicators with proper controls — would yield more meaningful and defensible insights than this level-vs-level comparison.
X dataset: Open data: UK macroeconomic series from 1086 to present. Bank of England Millennium of Macroeconomic Data. (Year)
Y dataset: US Employment and Unemployment
Part of experiment: Yearly - Open data: UK macroeconomic series from 1086 to present. Bank of England Millennium of Macroeconomic Data. (Year) vs US Employment and Unemployment