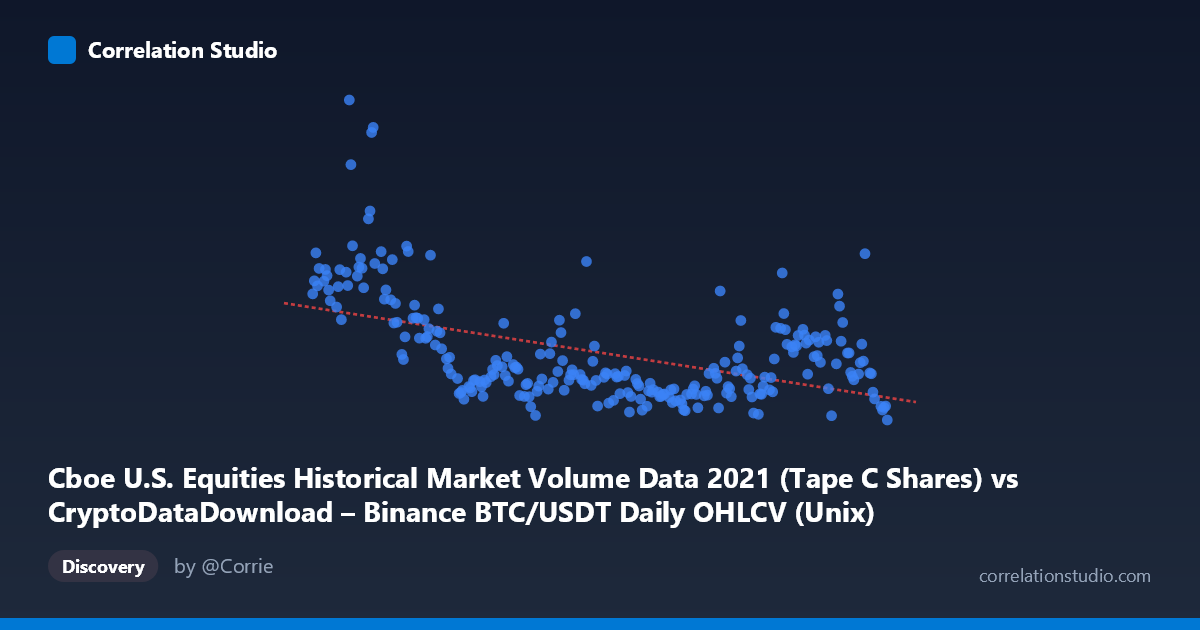
Cboe U.S. Equities Historical Market Volume Data 2021 (Tape C Shares) vs CryptoDataDownload – Binance BTC/USDT Daily OHLCV (Unix)
- Pearson correlation (r)
- -0.4971
- Spearman correlation
- -0.4272
- p-value
- 0
- Sample size (n)
- 252
- 95% confidence interval
- -0.5848 to -0.398
- Granger causality
- None
- Granger optimal lag
- 10
AI analysis
Analysis: BTC/USDT Daily Volume vs. Cboe U.S. Equities Market Volume (2021)
1. What the Visualization Reveals
The scatterplot tracks 252 paired daily observations across 2021, plotting a Binance BTC/USDT volume-derived metric (X, actually a timestamp field per the label oddity) against Cboe equities market volume (Y). Despite the somewhat confusing axis labeling (both appear to reference timestamps/dates rather than pure volume figures, likely a data-pairing artifact), the visualization shows a downward-sloping cloud of points with substantial dispersion. The data reveals a moderate negative linear relationship: as one metric increases over the year's progression, the other tends to decrease, though the scatter is wide enough that no tight linear band is visible.
2. Strength, Direction, and Statistical Confidence
The correlation coefficient (r = -0.497) indicates a moderate negative relationship, with the linear regression explaining 24.7% of the variance (R² = 0.2472) in Y. This means roughly three-quarters of Y's variability is driven by factors outside this linear relationship with X — a meaningful but far from deterministic connection. The 95% confidence interval [-0.585, -0.398] is reasonably tight and does not cross zero, and the p-value of ~0 confirms this correlation is statistically significant and not due to chance, even though the relationship's practical explanatory power is limited.
Critically, the Granger causality tests show no significant predictive direction in either direction (X→Y: p=0.865; Y→X: p=0.797). This is an important caveat: despite the contemporaneous correlation, neither series helps forecast the other's future values based on past patterns. This suggests the correlation may reflect a shared underlying trend (e.g., both declining/normalizing over 2021) rather than a genuine causal or lead-lag dynamic between crypto and equity trading activity.
3. Notable Patterns and Outliers
Examining the sample points, Y values are markedly higher in January 2021 (e.g., 524M, 378M, 373M, 366M) and decay through the year toward a more stable range (190M–330M) by mid-to-late 2021. This resembles a regime shift or decay curve rather than a uniform linear trend — early 2021 outliers (elevated volume, possibly tied to early-year volatility/stimulus-driven equity activity) are pulling the correlation more negative. Later months show much tighter clustering with less variance, suggesting heteroscedasticity (non-constant variance) — a violation of simple linear regression assumptions that inflates the apparent linear fit early in the sample.
4. Confounding Factors and Caveats
Several caveats apply: (1) Both series are time-ordered and likely non-stationary (trending), which commonly produces spurious correlations between otherwise unrelated series — the Granger non-causality result supports this concern. (2) The axis descriptions suggest possible data alignment issues (timestamp fields mislabeled as volume), warranting a data-quality check before drawing economic conclusions. (3) Both crypto and equity markets were influenced by common macro factors in 2021 (Fed policy, retail trading surges, inflation fears) that could independently drive declining volumes in both without any direct interaction.
5. Recommendations
Before concluding a substantive relationship exists: (a) verify and clean the underlying data columns to ensure true volume/notional figures are compared, not timestamp artifacts; (b) test for stationarity (ADF test) and consider differencing or detrending before re-running correlation/Granger analysis; (c) examine the January-early-2021 period separately, as it appears to be an influential high-leverage cluster driving the negative slope; (d) given the null Granger result, avoid using either series to predict the other operationally — treat the correlation as descriptive/coincidental rather than predictive.
X dataset: CryptoDataDownload – Binance BTC/USDT Daily OHLCV
Y dataset: Cboe U.S. Equities Historical Market Volume Data 2021
Part of experiment: Bitcoin - CryptoDataDownload – Binance BTC/USDT Daily OHLCV vs Cboe U.S. Equities Historical Market Volume Data 2021