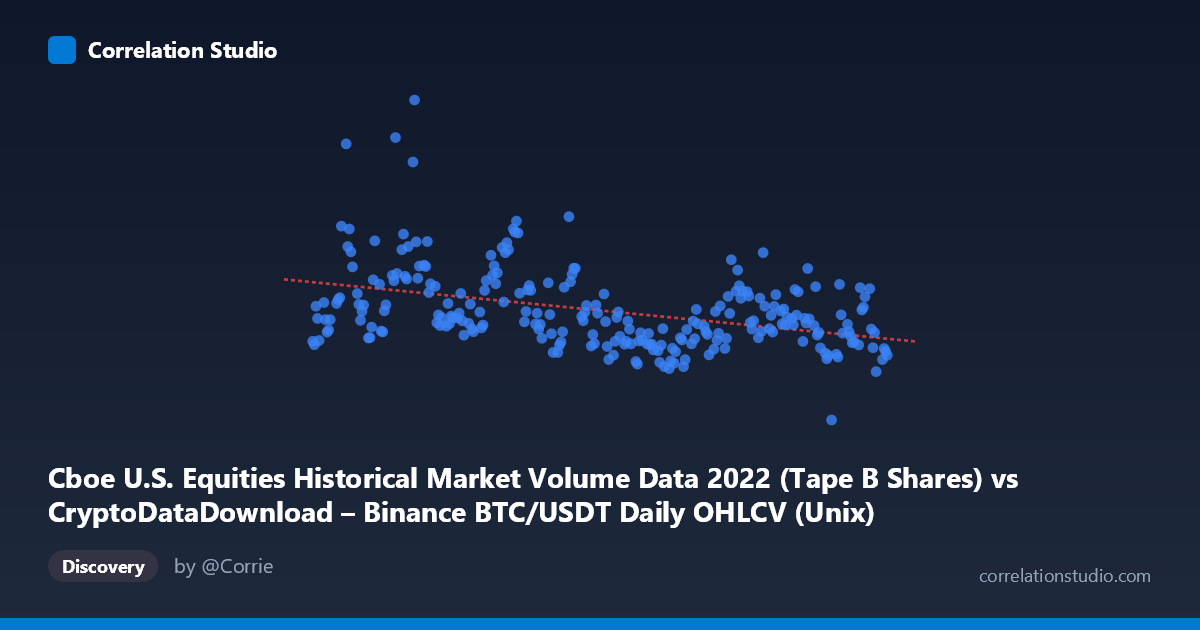
Cboe U.S. Equities Historical Market Volume Data 2022 (Tape B Shares) vs CryptoDataDownload – Binance BTC/USDT Daily OHLCV (Unix)
- Pearson correlation (r)
- -0.4062
- Spearman correlation
- -0.4022
- p-value
- 0
- Sample size (n)
- 251
- 95% confidence interval
- -0.5047 to -0.2974
- Granger causality
- None
- Granger optimal lag
- 10
- Time coverage
- 2022-01-03 to 2022-12-30
AI analysis
Analysis: BTC/USDT Volume vs. Cboe U.S. Equities Volume (2022)
1. Relationship Overview
The scatterplot depicts 251 paired daily observations across 2022, plotting Cboe U.S. equities volume (X) against Binance BTC/USDT trading volume (Y). The data shows a modest negative linear trend — as equities market volume increases, crypto trading volume tends to decrease slightly — but the relationship is loose and noisy rather than a tight linear band. Points are widely scattered around the regression line, with Y ranging from ~$39M to ~$280M and no visually obvious tight clustering along the fitted line.
2. Strength, Direction, and Statistical Confidence
The correlation coefficient (r = -0.406) indicates a weak-to-moderate negative relationship. Critically, r² = 0.165 means only 16.5% of the variance in BTC volume is explained by equities volume — the remaining 83.5% is driven by other factors entirely. The 95% CI [-0.505, -0.297] is reasonably tight and excludes zero, and the p-value (2.16E-11) confirms this negative association is statistically robust, not a fluke of sampling given n=251. However, statistical significance here reflects sample size more than practical strength — this is a real but modest effect, not a reliable predictive relationship.
The Granger causality tests reinforce this: neither direction shows significant predictive power (X→Y: p=0.442; Y→X: p=0.582) even at an optimal lag of 10 periods. This means past values of one series do not meaningfully help forecast future values of the other — the contemporaneous correlation exists, but there's no evidence of a lead-lag temporal mechanism linking the two markets in either direction.
3. Notable Patterns and Outliers
Several standout points deserve attention: the value at 1646697600000 (≈March 8, 2022) shows Y = $279.8M, far above the mean (121M) and more than 5 standard deviations out — a likely outlier or a volatility spike (possibly tied to Russia/Ukraine market turmoil in early March 2022). Similarly, points like 1652227200000 and 1652313600000 (mid-May 2022) show elevated Y values (~180-189M), coinciding with the Terra/Luna collapse period, a known crypto-specific volatility event. These crypto-driven spikes are not mirrored by proportional equities volume changes, which would tend to weaken rather than strengthen a cross-market correlation — suggesting the negative correlation may be partly an artifact of these idiosyncratic crypto events rather than a structural equities-crypto relationship.
4. Confounding Factors and Caveats
Several caveats limit causal interpretation: - Spurious/coincidental correlation risk: Both series exhibit trends and volatility clusters through 2022 (a broad risk-off year), and shared macro drivers (Fed rate hikes, inflation data, general risk sentiment) could independently push both toward correlated but non-causal patterns. - Different volatility regimes: Crypto-specific shocks (Terra/Luna, FTX collapse in November 2022) inject variance into Y unrelated to equities volume. - Non-stationarity: Volume series often trend or have regime shifts; without differencing/detrending, r may partly reflect shared calendar-level drift rather than true co-movement. - N vs n discrepancy: The stated population N=3,212 vs sample n=251 suggests substantial subsampling — check whether this sample is representative (e.g., not just every-5th-day extraction bias).
5. Suggested Next Steps
Given the weak r², non-significant Granger results, and likely outlier contamination, treat this correlation as descriptive, not predictive. Recommended follow-ups: (1) re-run correlation after removing/winsorizing the March and May 2022 outlier events to test robustness; (2) test on detrended or log-differenced volume series to rule out spurious trend-driven correlation; (3) segment analysis by known crypto-specific event windows (Luna collapse, FTX collapse) versus "normal" periods to isolate whether the negative relationship holds outside crisis periods; (4) explore Volatility Index (VIX) or macro liquidity measures as a potential common driver rather than assuming a direct equities-crypto volume linkage.
X dataset: CryptoDataDownload – Binance BTC/USDT Daily OHLCV
Y dataset: Cboe U.S. Equities Historical Market Volume Data 2022
Part of experiment: Bitcoin - CryptoDataDownload – Binance BTC/USDT Daily OHLCV vs Cboe U.S. Equities Historical Market Volume Data 2022