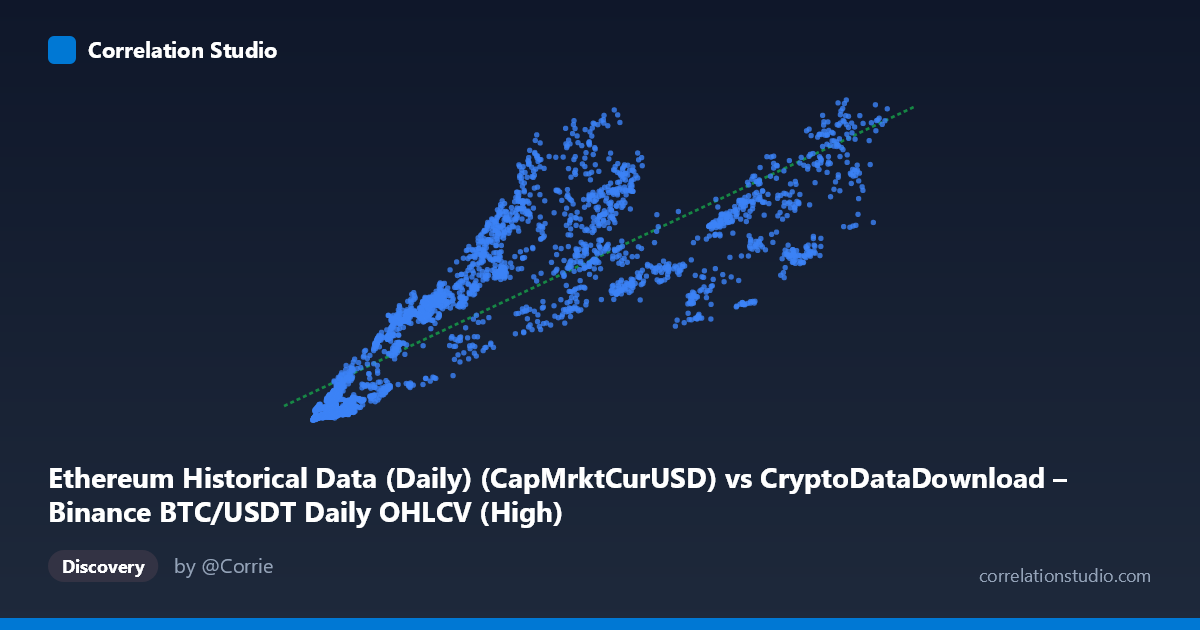
Ethereum Historical Data (Daily) (CapMrktCurUSD) vs CryptoDataDownload – Binance BTC/USDT Daily OHLCV (High)
- Pearson correlation (r)
- 0.8491
- Spearman correlation
- 0.913
- p-value
- 0
- Sample size (n)
- 3191
- 95% confidence interval
- 0.8392 to 0.8585
- Granger causality
- None
- Granger optimal lag
- 10
AI analysis
Analysis: Ethereum Market Cap vs. BTC/USDT Daily High
Note on labeling: The axis labels appear mismatched with the described datasets (X is labeled as Ethereum market cap but described as coming from BTC OHLCV data, and vice versa). Proceeding with the data as presented: X ranges ~3,276–126,200 and Y ranges ~8.6B–584.6B, consistent with a price-like metric (X) versus a market-cap-like metric (Y).
1. Relationship Overview The scatterplot reveals a strong positive, roughly linear relationship between the two variables. As X increases from the low thousands to over 100,000, Y scales upward from single-digit billions to hundreds of billions, tracking a fitted line of y ≈ 3.99M·x + 45.1B. The sample points confirm this: low-X observations (X < 10,000) cluster tightly in the Y range of 15B–70B, while high-X observations (X 80,000) push Y into the 200B–520B range. This is consistent with two assets that are both driven by the same broad crypto market cycles (bull/bear phases).
2. Strength, Direction, and Uncertainty The correlation coefficient (r = 0.849) indicates a strong positive linear relationship, with r² = 0.721 meaning about 72% of the variance in Y is explained by X's linear trend — leaving ~28% unexplained by this simple relationship. The 95% CI [0.839, 0.859] is narrow, and the p-value is effectively 0, so the correlation itself is highly statistically reliable given the large sample (n=3,191) — there is essentially no doubt that a genuine, non-zero association exists. However, statistical significance and correlation strength should not be conflated with causal or predictive value: the Granger causality tests show no significant predictive direction in either direction (X→Y: p=0.72; Y→X: p=0.76) at the optimal 10-period lag. This means neither variable's past values help forecast the other's future values beyond what's already known — the strong contemporaneous correlation likely reflects a shared external driver (e.g., overall crypto market sentiment, capital flows, macro liquidity conditions) rather than one asset leading the other.
3. Patterns and Irregularities Several notable features emerge from the sample data: - Non-uniform scaling / heteroskedasticity: variance in Y increases substantially at higher X values (e.g., near X≈80,000, Y ranges from 188B to 517B — a huge spread), suggesting the relationship may not be strictly linear and could benefit from a log-log transformation. - Clustering by regime: there appear to be distinct clusters — a low-X/low-Y cluster (X<15,000), a mid-range cluster (X: 20,000–60,000, Y: 150B–300B), and a high-X cluster (X80,000, Y: 200B–520B) — likely corresponding to different market cycles/years (2017-2026 span includes multiple bull/bear cycles). - Outlier-like behavior: some points break the trend, e.g., (11308.42, 102.4B) sits well above the typical Y for that X range, while (84300, 188.9B) sits below the typical Y for its X range, suggesting decoupling during certain periods (potentially ETH-specific events like The Merge, or BTC-specific halving cycles).
4. Confounding Factors and Caveats This is time-series data spanning nearly 9 years (2017–2026), so both variables are almost certainly non-stationary and trending together due to shared macro crypto-market cycles (overall market cap growth, Bitcoin dominance shifts, regulatory news, and macroeconomic liquidity conditions like interest rates). This creates a classic spurious correlation risk even though the statistical test is significant — two independently trending time series will show high r purely from co-trending, not necessarily meaningful direct relationship. The lack of Granger causality reinforces this concern: if X truly drove Y (or vice-versa) mechanically, we'd expect predictive power at some lag. Additionally, daily crypto data is highly autocorrelated (today's price is close to yesterday's), inflating the apparent sample size's independence — the effective degrees of freedom are likely much lower than n=3,191 suggests, meaning the "p=0" should be interpreted cautiously.
5. Recommendations for Further Investigation - Detrend or difference the series (e.g., use daily/weekly returns instead of levels) and recompute correlation — this will reveal whether the relationship holds for short-term co-movements or is purely a product of shared long-term trend. - Test log-transformed variables given the apparent heteroskedasticity and multiplicative growth patterns typical of market caps/prices. - Segment by market regime (bull vs. bear, pre/post major events like The Merge or BTC halvings) to see if the relationship strength or slope changes across cycles. - Include a third variable (e.g., total crypto market cap, DXY, or S&P 500) as a control to test whether the ETH-BTC relationship is truly direct or mediated by broader market conditions. - Given no Granger causality, avoid using one series to forecast the other in trading/predictive models; treat the correlation as descriptive/contemporaneous only, not predictive.
X dataset: CryptoDataDownload – Binance BTC/USDT Daily OHLCV
Y dataset: Ethereum Historical Data (Daily)
Part of experiment: Bitcoin - CryptoDataDownload – Binance BTC/USDT Daily OHLCV vs Ethereum Historical Data (Daily)