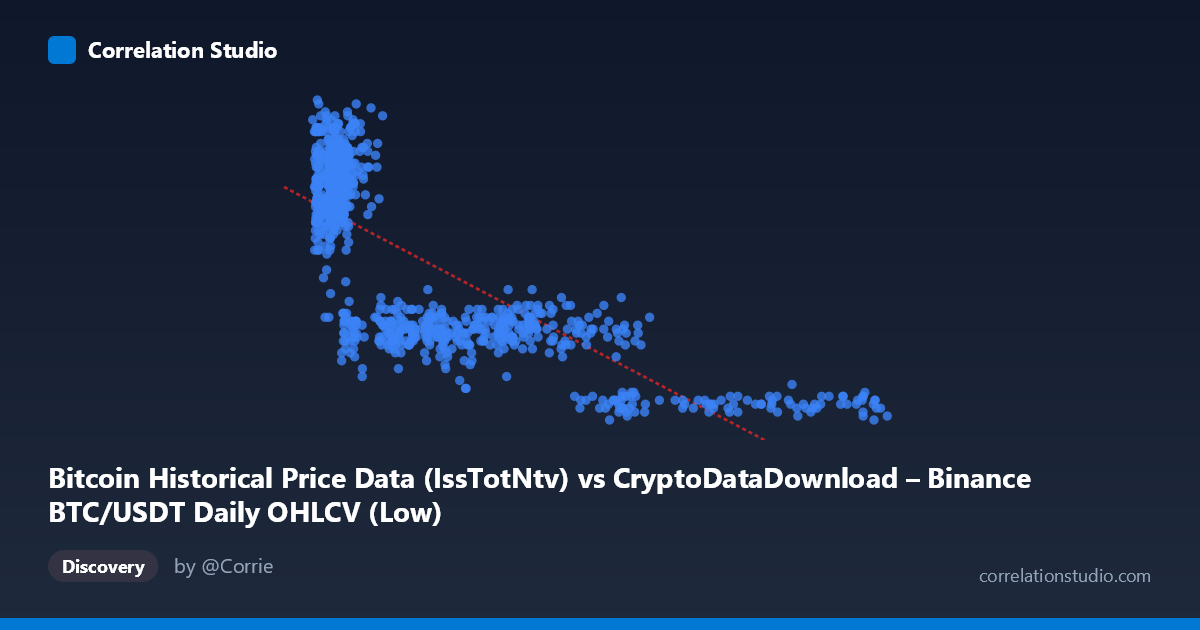
Bitcoin Historical Price Data (IssTotNtv) vs CryptoDataDownload – Binance BTC/USDT Daily OHLCV (Low)
- Pearson correlation (r)
- -0.7762
- Spearman correlation
- -0.7635
- p-value
- 0
- Sample size (n)
- 938
- 95% confidence interval
- -0.8004 to -0.7494
- Granger causality
- None
- Granger optimal lag
- 10
- Time coverage
- 2017-08-20 to 2026-05-20
AI analysis
Scatterplot Analysis: BTC IssTotNtv vs. BTC/USDT Low Price
1. Relationship Overview
The scatterplot reveals a clear negative, non-linear relationship between the X variable (labeled "IssTotNtv" but numerically behaving like a price/valuation metric ranging ~2,800–120,000) and Y (BTC/USDT daily low price, ~350–2,375). The data forms a curved pattern consistent with an inverse or logarithmic decay: Y values cluster tightly in the 1,600–2,200 range when X is low (under ~10,000), then drop steadily and asymptotically toward 400–950 as X climbs above 30,000–100,000+. This shape suggests the true relationship is better modeled by a power, log, or hyperbolic function rather than a straight line.
2. Strength, Direction, and Statistical Confidence
The Pearson correlation of r = -0.776 indicates a strong negative linear association, with r² = 0.602 meaning the linear fit explains about 60% of the variance in Y — a substantial but incomplete share, leaving ~40% attributable to other factors or nonlinear structure. The 95% CI [-0.800, -0.749] is tight and does not cross zero, and the p-value ≈ 0 confirms this relationship is highly unlikely to be due to chance given the large sample (n=938). However, the Granger causality tests show no significant predictive direction in either direction (X→Y: p=0.28; Y→X: p=0.70) even at an optimal lag of 10 periods. This is an important distinction: strong contemporaneous correlation does not imply that one variable temporally leads or forecasts the other — the relationship may be driven by a shared underlying trend (e.g., both series reflecting overall market conditions or time-based drift) rather than one causing changes in the other.
3. Notable Patterns and Outliers
The data shows a dense cluster at low X (3,000–15,000) with Y ranging widely (1,600–2,300), indicating high variance in this regime — small changes in X correspond to large swings in Y. Conversely, at high X (60,000), points compress into a narrow low-Y band (400–950), showing a floor effect or saturation. This heteroscedasticity (funnel-shaped spread) violates simple linear regression assumptions and reinforces that a curved/log-transformed model would fit better. No extreme outliers stand out; rather, the entire dataset follows a consistent curved envelope, suggesting a structural rather than anomalous relationship.
4. Confounding Factors and Caveats
Both variables are derived from the same underlying asset (BTC/USDT), and X is described as "Issued Total Native" units while Y is the daily low price — these are likely mechanically or economically linked (e.g., as issuance/supply grows over time, price dynamics shift), rather than being independent phenomena. Time is a major latent confounder: with data spanning 2017–2026, both series likely trend with Bitcoin's overall market cycles (bull/bear phases), inflation of circulating supply, and macro conditions — producing spurious-looking correlation from shared temporal drift rather than direct causal linkage. Additionally, mixing "Historical Price Data" and "Network/Price Metrics" datasets raises alignment risk (different sampling frequencies, timestamp mismatches, or interpolation) that could distort the true relationship.
5. Recommendations for Further Investigation
Given the visible curvature, a log-log or log-linear transformation of X (and possibly Y) should be tested to see if it improves fit beyond the current 60% R². Since Granger tests show no lead-lag predictability, this pair is not suitable for forecasting one from the other in a time-series sense — treat the correlation as descriptive/structural, not predictive. Further work should (a) detrend both series or analyze first differences to control for shared time trends, (b) segment the analysis by market regime (bull vs. bear) to check if the negative correlation strength/direction is stable, and (c) verify the true definition and units of "IssTotNtv" to confirm it isn't a transformed/cumulative version of price itself, which could explain the strong but non-causal association.
X dataset: CryptoDataDownload – Binance BTC/USDT Daily OHLCV
Y dataset: Bitcoin Historical Price Data
Part of experiment: Bitcoin - CryptoDataDownload – Binance BTC/USDT Daily OHLCV vs Bitcoin Historical Price Data