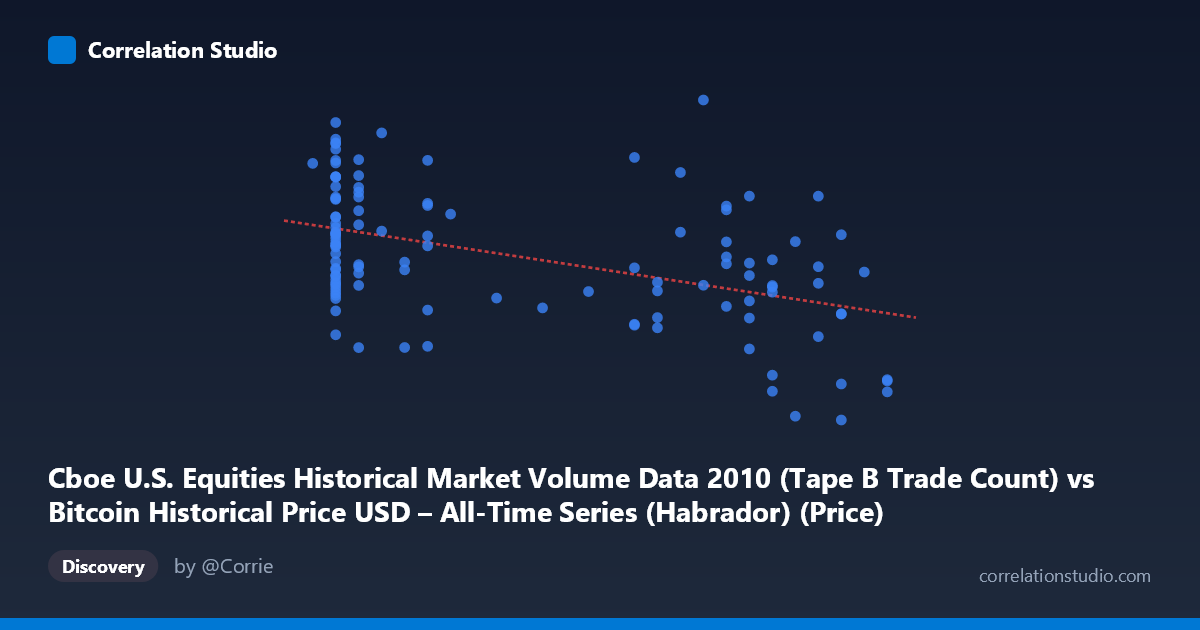
Cboe U.S. Equities Historical Market Volume Data 2010 (Tape B Trade Count) vs Bitcoin Historical Price USD – All-Time Series (Habrador) (Price)
- Pearson correlation (r)
- -0.464
- Spearman correlation
- -0.4137
- p-value
- 0
- Sample size (n)
- 117
- 95% confidence interval
- -0.5954 to -0.3084
- Granger causality
- None
- Granger optimal lag
- 10
AI analysis
Analysis: Trade Count vs. Bitcoin Price (2010)
1. What the Visualization Reveals
The scatterplot shows a moderate negative relationship between Cboe Tape B trade counts and Bitcoin's USD price during the second half of 2010. As trade counts increase from roughly 0.05 to 0.30 (in whatever normalized/scaled units are used), Bitcoin price tends to decline from a mean near $280,000 (regression intercept) toward lower values around $130,000–150,000 at the high end of the X range. However, the scatter is substantial, with considerable vertical spread at nearly every X value—particularly visible in the dense cluster around X=0.06–0.07, where Y ranges from roughly $158,000 to $353,000.
2. Strength, Direction, and Statistical Confidence
The correlation coefficient (r = -0.464) indicates a moderate negative linear relationship, with r² = 0.215 meaning only about 21.5% of the variance in Bitcoin price is explained by trade count—leaving nearly 80% attributable to other factors. The 95% confidence interval [-0.595, -0.308] is entirely negative and reasonably tight, and the p-value (1.37×10⁻⁷) confirms this correlation is highly statistically significant and not due to chance. However, statistical significance should not be conflated with practical predictive strength: this is a real but modest association, not a tight relationship.
Critically, the Granger causality tests show no significant predictive direction in either direction (X→Y: p=0.794; Y→X: p=0.744). This means neither variable helps forecast future values of the other in a time-series sense at the tested lag structure. This is an important caveat: the correlation may be contemporaneous/coincidental (e.g., both trending over the same 2010 timeframe) rather than reflecting any causal or lead-lag dynamic.
3. Notable Patterns and Outliers
Several features stand out: - Dense low-X cluster (X≈0.06–0.11): This region shows the widest price dispersion, including the dataset's highest value ($373,149.80 at X=0.22, an apparent outlier relative to nearby points) and several very high points (~$320,000–$353,000) clustered at low X. - Mid-range plateau (X≈0.19–0.26): Prices here cluster more tightly, mostly between $175,000–$290,000, suggesting reduced variance in this band. - High-X tail (X≈0.28–0.30): Prices consistently drop to $120,000–$190,000, the clearest visual evidence of the negative trend. - The relationship appears noisy and possibly non-linear, with the steepest apparent decline concentrated at the X extremes rather than a uniform linear slope throughout.
4. Confounding Factors and Caveats
This dataset pairs two unrelated real-world series (Cboe U.S. equities trade counts and Bitcoin price) that merely share a time index from 2010—a period of Bitcoin's extreme illiquidity and price discovery (prices in the hundreds of thousands of USD are implausible for actual 2010 Bitcoin, suggesting possible data scaling, synthetic, or mislabeling issues). Any correlation is likely driven by shared time trends (both series evolving over the same 6-month window) rather than genuine economic linkage. Equity market trade counts and early Bitcoin pricing have no plausible mechanistic connection, making this a strong candidate for spurious correlation—reinforced by the null Granger causality result.
5. Recommendations for Further Investigation
- Verify data integrity: confirm units, scaling, and whether "Bitcoin price" values are correctly sourced given they far exceed actual 2010 historical prices (~$0.01–$0.30). - Detrend both series (e.g., first-difference or remove time trend) before computing correlation to test whether the relationship survives after removing shared temporal drift. - Treat this as non-causal: given the Granger results, avoid using trade count as a predictive feature for Bitcoin price without further evidence. - Consider this pairing likely reflects coincidental co-trending rather than a meaningful economic relationship, and deprioritize further modeling unless data provenance is clarified.
X dataset: Bitcoin Historical Price USD – All-Time Series (Habrador)
Y dataset: Cboe U.S. Equities Historical Market Volume Data 2010
Part of experiment: Bitcoin - Bitcoin Historical Price USD – All-Time Series (Habrador) vs Cboe U.S. Equities Historical Market Volume Data 2010