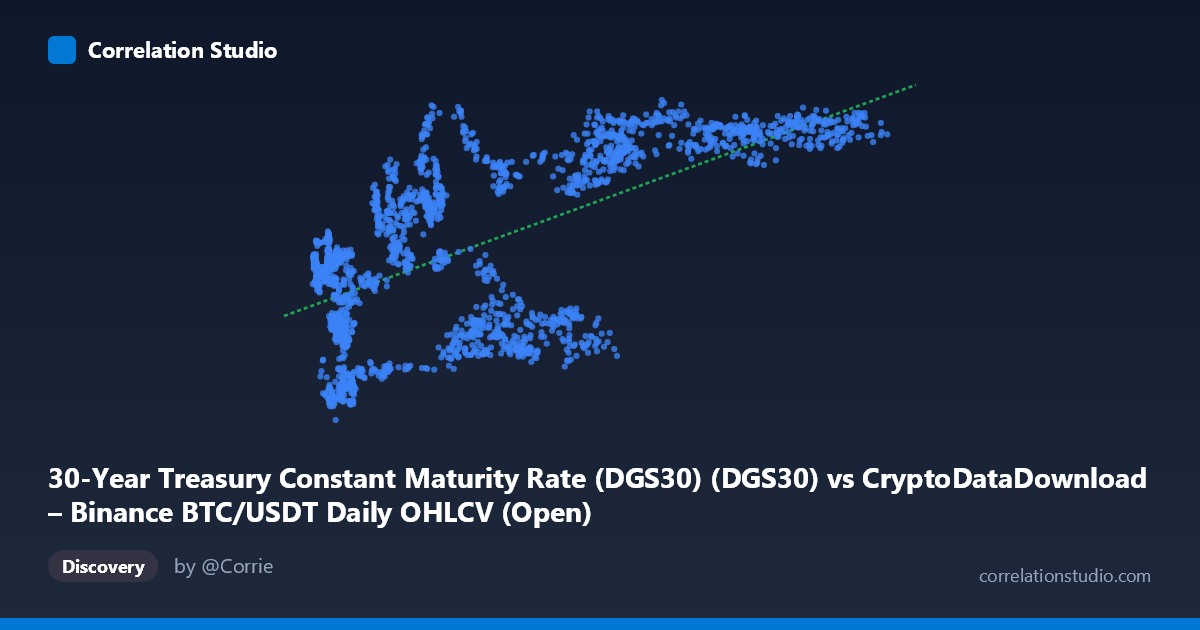
30-Year Treasury Constant Maturity Rate (DGS30) (DGS30) vs CryptoDataDownload – Binance BTC/USDT Daily OHLCV (Open)
- Pearson correlation (r)
- 0.6495
- Spearman correlation
- 0.5708
- p-value
- 0
- Sample size (n)
- 2197
- 95% confidence interval
- 0.6246 to 0.673
- Granger causality
- None
- Granger optimal lag
- 1
AI analysis
Analysis: BTC/USDT Price vs. 30-Year Treasury Yield
Note on axis labeling: The metadata appears swapped — the described "X-axis" (DGS30) and "Y-axis" (BTC Open) don't match the actual data ranges shown (X spans 3,188–124,658, consistent with BTC/USDT prices; Y spans 0.99–5.18, consistent with 30-year Treasury yields as percentages). This analysis proceeds treating X = BTC/USDT price and Y = 30-Year Treasury yield, which aligns with the sample data.
1. What the Visualization Reveals The scatterplot shows a positive, moderately strong association between BTC price and the 30-year Treasury yield. As BTC prices rise from the ~3,000–10,000 range toward six figures, yields climb from roughly 1–2% toward the 4.5–5% band. The relationship is not perfectly linear — it looks more like a curved or saturating pattern, with yields rising steeply through the low-to-mid price range and then flattening/clustering near 4.5–5% at the highest BTC prices (70,000+).
2. Strength, Direction, and Statistical Confidence The correlation coefficient (r = 0.65) indicates a moderate-to-strong positive linear relationship, with r² = 0.42 meaning BTC price alone explains about 42% of the variance in the 30-year yield — leaving the majority (58%) unexplained by this single variable. The 95% CI [0.625, 0.673] is tight given the large sample (n=2,197), and the p-value ≈ 0 confirms the correlation is highly statistically significant and not due to chance. However, statistical significance ≠ practical/causal significance. The Granger causality tests are telling: neither direction reaches conventional significance (BTC→Yield: p=0.060; Yield→BTC: p=0.364), meaning there's no strong evidence that past values of one variable help predict future values of the other. This suggests the correlation is likely driven by a shared underlying macro trend (e.g., both rising over 2020–2024 due to inflation, rate-hike cycles, and risk-on sentiment) rather than one variable causally driving the other.
3. Notable Patterns and Features - Clustering at extremes: Low BTC prices (<20,000) cluster with low yields (1.4–3.5%), while high BTC prices (60,000) cluster tightly near 4.5–5.0% yields — suggesting a ceiling effect in yields even as BTC continues climbing. - Non-linearity: The relationship resembles a logarithmic or saturating curve rather than a straight line — yield sensitivity to BTC price appears to diminish at higher price levels. - Scatter/noise in mid-range: Between BTC prices of 30,000–60,000, yields vary widely (1.8% to 4.7%) for similar price levels, indicating substantial unexplained variance and possible regime shifts (e.g., different time periods with different rate environments producing similar BTC prices). - Outliers: Points like (6,444, 3.05) and (58,976, 2.37) deviate from the general trend, likely reflecting specific time periods with unusual monetary conditions (e.g., 2020 COVID-era low rates coinciding with rising BTC, or 2022 rate hikes with falling BTC).
4. Confounding Factors and Caveats This is almost certainly a spurious or confounded correlation driven by time itself. Both series have trended upward over the 2017–2026 sample period — BTC due to adoption/speculation cycles, and the 30-year yield due to the Fed's post-COVID tightening cycle and inflation dynamics. Regressing two non-stationary time series that share a common trend routinely produces inflated correlation coefficients even absent any real economic link. The lack of significant Granger causality in either direction strongly supports this interpretation. Other confounders likely include: inflation expectations, Fed policy stance, general risk appetite/liquidity conditions, and macro regime changes (2020 zero-rate era vs. 2022–2023 hiking cycle) that simultaneously affected both asset classes.
5. Suggested Further Investigation - Test for stationarity (ADF/KPSS tests) on both series; if non-stationary, apply differencing or use returns/changes rather than levels before computing correlation. - Detrend or use cointegration analysis (Engle-Granger or Johansen test) to check for a genuine long-run equilibrium relationship versus a spurious trend correlation. - Control for time/macro regime by segmenting the analysis into sub-periods (2017–2019, 2020–2021 ZIRP, 2022–2023 hiking cycle, 2024+) to see if the relationship holds within each regime or only appears when pooling across them. - Introduce a third variable (e.g., Fed funds rate, CPI, DXY index) to test whether both BTC and the 30Y yield are jointly driven by a common macro factor, which would better explain the observed correlation than any direct link between crypto prices and long-term bond yields.
X dataset: CryptoDataDownload – Binance BTC/USDT Daily OHLCV
Y dataset: 30-Year Treasury Constant Maturity Rate (DGS30)
Part of experiment: Bitcoin - CryptoDataDownload – Binance BTC/USDT Daily OHLCV vs 30-Year Treasury Constant Maturity Rate (DGS30)