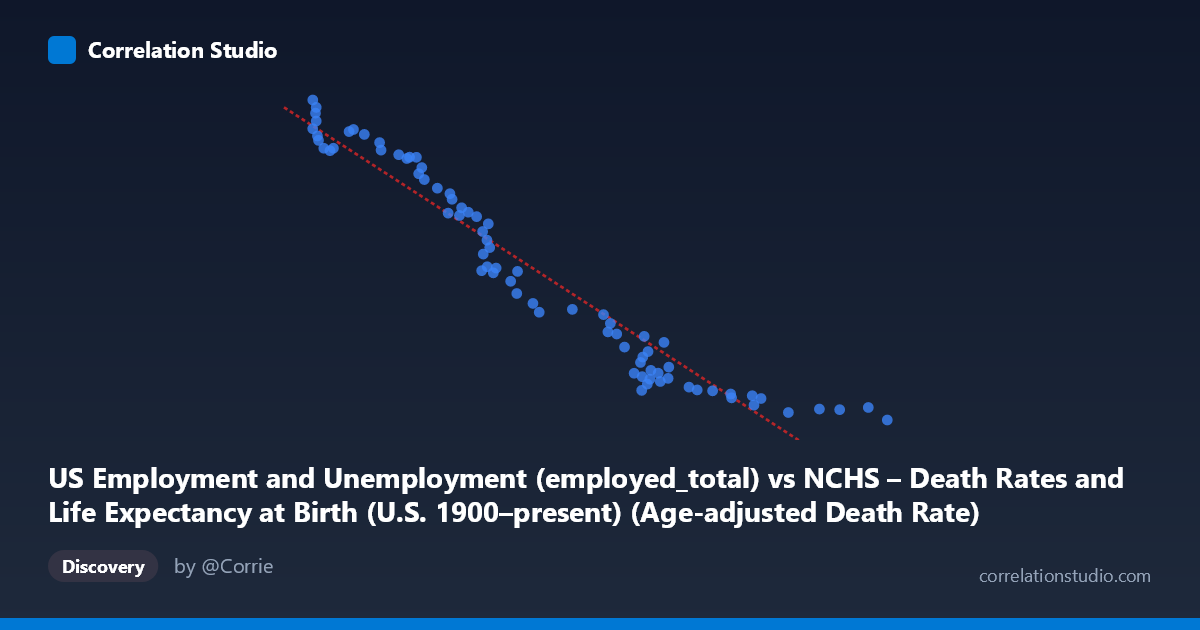
US Employment and Unemployment (employed_total) vs NCHS – Death Rates and Life Expectancy at Birth (U.S. 1900–present) (Age-adjusted Death Rate)
- Pearson correlation (r)
- -0.9663
- Spearman correlation
- -0.9867
- p-value
- 0
- Sample size (n)
- 78
- 95% confidence interval
- -0.9784 to -0.9475
- Granger causality
- None
- Granger optimal lag
- 10
- Time coverage
- 1941-01-01 to 2018-01-01
AI analysis
Analysis: US Total Employment vs. Age-Adjusted Death Rate (1941–2018)
Relationship Overview
The scatterplot reveals a striking strong negative relationship between total US employment and the age-adjusted death rate: as employment grows, mortality rates fall substantially. The linear regression equation (y = −116.16x + 237,426) indicates that for every additional thousand employed workers, the age-adjusted death rate decreases by approximately 116 units. Visually, the data follow a tight, downward-sloping trajectory from the upper-left (low employment, high death rates) to the lower-right (high employment, low death rates), consistent with nearly eight decades of simultaneous improvement in both labor market scale and population health outcomes.
Correlation Strength and Statistical Significance
The Pearson correlation of r = −0.9663 is exceptionally strong, and the coefficient of determination r² = 0.9337 means that approximately 93.4% of the variance in age-adjusted death rates is statistically explained by total employment levels. The 95% confidence interval [−0.9784, −0.9475] is narrow and lies entirely in negative territory, and the p-value is effectively zero — making this one of the most statistically robust correlations observable in long-run demographic data. However, Granger causality tests tell a more cautionary story: neither direction (X→Y: F = 1.57, p = 0.14; Y→X: F = 1.65, p = 0.12) reaches significance even at an optimal lag of 10 periods. This means that despite the extraordinary correlational strength, neither variable demonstrably predicts the other temporally, strongly suggesting the relationship is driven by a shared underlying trend rather than direct causal linkage.
Notable Patterns and Outliers
The data cluster into two broadly distinguishable regions. Points in the lower-left (employment ~780–900K, death rates ~140,000–156,000) correspond to early decades (1940s–1960s), while the dense cluster in the lower-right (employment ~1,300–1,830, death rates ~50,000–85,000) reflects the modern era. A handful of notable outliers exist near X ≈ 776–787 with death rates exceeding 150,000 (including the maximum at 155,761), suggesting early wartime or immediate post-war mortality peaks. The relationship also shows mild curvature in the lower-employment range — death rates drop steeply as employment first expands — with a flattening tendency at higher employment levels, hinting that a logarithmic or power-law model might marginally outperform the linear fit, even with r² already at 93%.
Confounding Factors and Caveats
This correlation is a textbook example of "third-variable" or spurious correlation driven by secular time trends. Both employment (population growth, economic expansion) and age-adjusted death rates (medical advances, public health infrastructure, reduced infectious disease burden) share a common driver: time itself. Over 1941–2018, virtually every long-run socioeconomic and biomedical indicator trends in the same direction. Antibiotic adoption, vaccine programs, cardiovascular treatment improvements, smoking decline, and improved occupational safety all reduce mortality independently of employment levels. Similarly, population growth mechanically raises total employment. The failure of Granger causality to achieve significance reinforces this interpretation — if employment genuinely caused mortality reductions, we would expect lagged employment to predict future death rates, which it does not.
Actionable Insights and Further Investigation
Researchers should detrend both series (e.g., via first-differencing or HP filtering) before drawing any substantive conclusions, as the raw correlation almost certainly conflates a genuine signal with shared secular trends. It would be worthwhile to examine whether employment rate or unemployment rate (rather than total employed) correlates with mortality after controlling for population size, since unemployment is a well-documented social determinant of health. Disaggregating by race and sex (available in the NCHS dataset) could reveal whether certain subgroups show stronger or weaker mortality-employment coupling. Finally, introducing explicit time as a covariate in a multiple regression — or fitting an error-correction model to capture long-run cointegration — would help isolate any genuine relationship between labor market conditions and population health from the overwhelming influence of historical time trends.
X dataset: NCHS – Death Rates and Life Expectancy at Birth (U.S. 1900–present)
Y dataset: US Employment and Unemployment
Part of experiment: Yearly - NCHS – Death Rates and Life Expectancy at Birth (U.S. 1900–present) vs US Employment and Unemployment