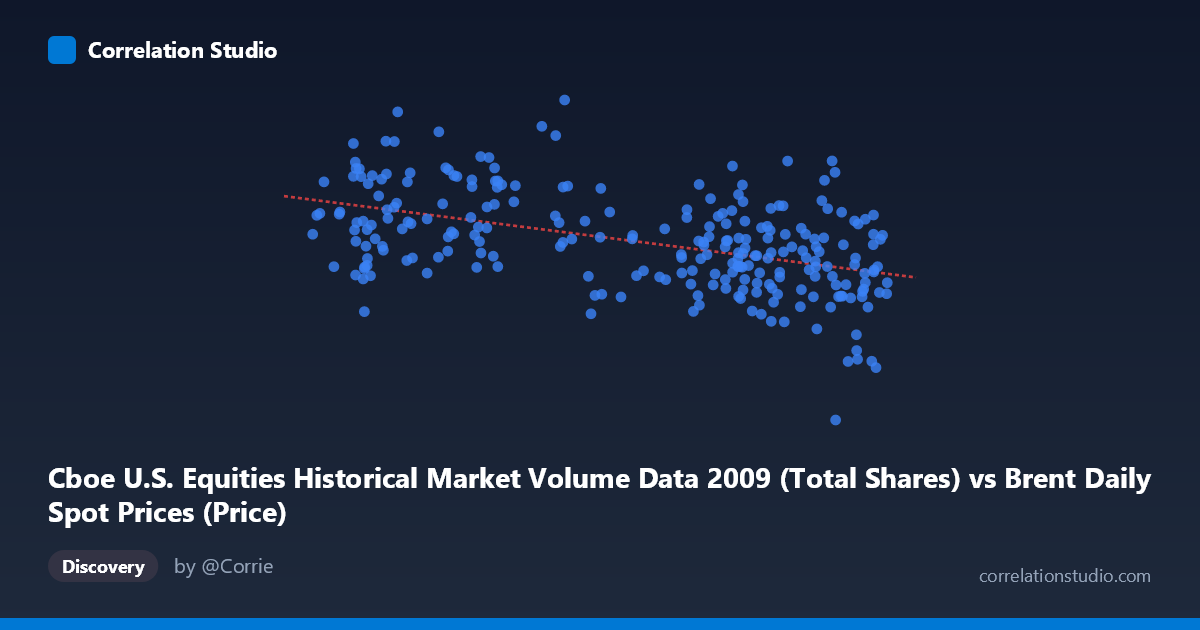
Cboe U.S. Equities Historical Market Volume Data 2009 (Total Shares) vs Brent Daily Spot Prices (Price)
- Pearson correlation (r)
- -0.4765
- Spearman correlation
- -0.4574
- p-value
- 0
- Sample size (n)
- 252
- 95% confidence interval
- -0.5667 to -0.375
- Granger causality
- None
- Granger optimal lag
- 10
- Time coverage
- 2009-01-02 to 2009-12-31
- Recomputed on refreshed data
- 2026-10-22 (r was -0.4765)
AI analysis
Scatterplot Analysis: Cboe U.S. Equity Market Volume vs. Brent Crude Oil Prices (2009)
1. Overall Relationship The scatterplot reveals a moderate negative relationship between daily U.S. equity market trading volume (Total Shares) and Brent crude oil spot prices across the 2009 trading year. As equity market volume increases, oil prices tend to decline, and vice versa. The linear regression equation (y = -6.00478×10⁶x + 1.13097×10⁹) confirms this inverse slope, suggesting that for each unit increase in share volume, Brent prices decrease by approximately $6 million in model terms. Visually, the data points are widely dispersed rather than tightly clustered around the regression line, immediately signaling that this relationship, while real, is far from deterministic.
2. Correlation Strength, Direction, and Statistical Significance The Pearson correlation of r = -0.4765 indicates a moderate negative association. However, the coefficient of determination r² = 0.2271 means that only ~22.7% of the variance in Brent oil prices is explained by equity market volume — leaving roughly 77% of price variation attributable to other factors. The 95% confidence interval of [-0.5667, -0.3750] is meaningfully narrow and does not cross zero, reflecting reasonably precise estimation given the sample size of n = 252. The p-value of 1.11×10⁻¹⁵ is extraordinarily small, confirming the correlation is highly statistically significant and extremely unlikely to be a chance artifact, particularly given the large population of N = 3,232. That said, statistical significance does not imply practical or causal significance. Critically, the Granger causality tests reveal no significant predictive directionality in either direction (X→Y: F = 1.49, p = 0.14; Y→X: F = 1.72, p = 0.08), meaning neither variable reliably predicts the other's future values at the optimal 10-period lag. This substantially limits any claim that volume "drives" prices or vice versa in a temporal sense.
3. Notable Patterns, Clusters, and Outliers Several features stand out in the data: - High-volume, lower-price cluster: Points in the x-range of ~40–55 billion shares tend to cluster at higher oil price levels (roughly $850M–$1,100M range), consistent with the negative slope. - High-volume outliers at lower prices: The point (75.15, 192,269,942.50) is a striking outlier — extremely high volume paired with an exceptionally low oil price, sitting far below the bulk of observations and likely pulling the regression line. - Low-volume, high-price outliers: (56.63, 1,212,524,830.85) represents the highest oil price in the sample at a mid-range volume level, suggesting idiosyncratic price spikes. - Wide vertical spread at mid-range volumes (~60–72 billion shares): A broad vertical dispersion of Y values at similar X values indicates substantial noise and heteroscedasticity, weakening predictive reliability across that range. - The overall scatter appears fan-shaped, with greater variance in oil prices at lower volume levels, suggesting the relationship may not be strictly linear.
4. Confounding Factors and Interpretive Caveats Several important caveats apply. 2009 was a structurally anomalous year: U.S. equity markets were emerging from the 2008 financial crisis, with oil prices recovering from a historic collapse (~$35/barrel in late 2008 to ~$80 by year-end 2009). These coincident trends could create a spurious correlation driven by a shared underlying driver — macroeconomic recovery — rather than any direct causal mechanism between equity volume and oil prices. High trading volume in early 2009 likely reflected panic selling and volatility during market distress, when oil prices were also suppressed, naturally producing the negative correlation. Additionally, daily volume is influenced by market microstructure factors (index rebalancing, options expiration, algorithmic trading) entirely unrelated to commodity pricing. The dataset label mismatch noted in the axis descriptions (the X column is labeled as from "Brent Daily Spot Prices" dataset but contains volume data, and vice versa) also warrants data provenance verification before drawing firm conclusions.
5. Actionable Insights and Further Investigation Given the moderate correlation, the absence of Granger causality, and the crisis-year context, several steps are warranted: - Extend the time horizon across multiple years to test whether this negative correlation is structural or unique to 2009's recovery dynamics. - Control for macroeconomic confounders such as the VIX volatility index, USD index, or recession indicators, which likely co-vary with both equity volume and oil prices. - Explore non-linear models (e.g., quadratic, spline regression) given the apparent heteroscedasticity and the potential fan-shape in the scatter. - Investigate the outlier at (75.15, 192.3M) specifically — identifying the date and news context could reveal whether it represents data error or a genuine market event. - Segment the analysis by market regime (e.g., Q1 crisis period vs. Q3–Q4 recovery) to test whether the correlation is stable or driven by a specific sub-period.
X dataset: Brent Daily Spot Prices
Y dataset: Cboe U.S. Equities Historical Market Volume Data 2009
Part of experiment: Daily - Brent Daily Spot Prices vs Cboe U.S. Equities Historical Market Volume Data 2009