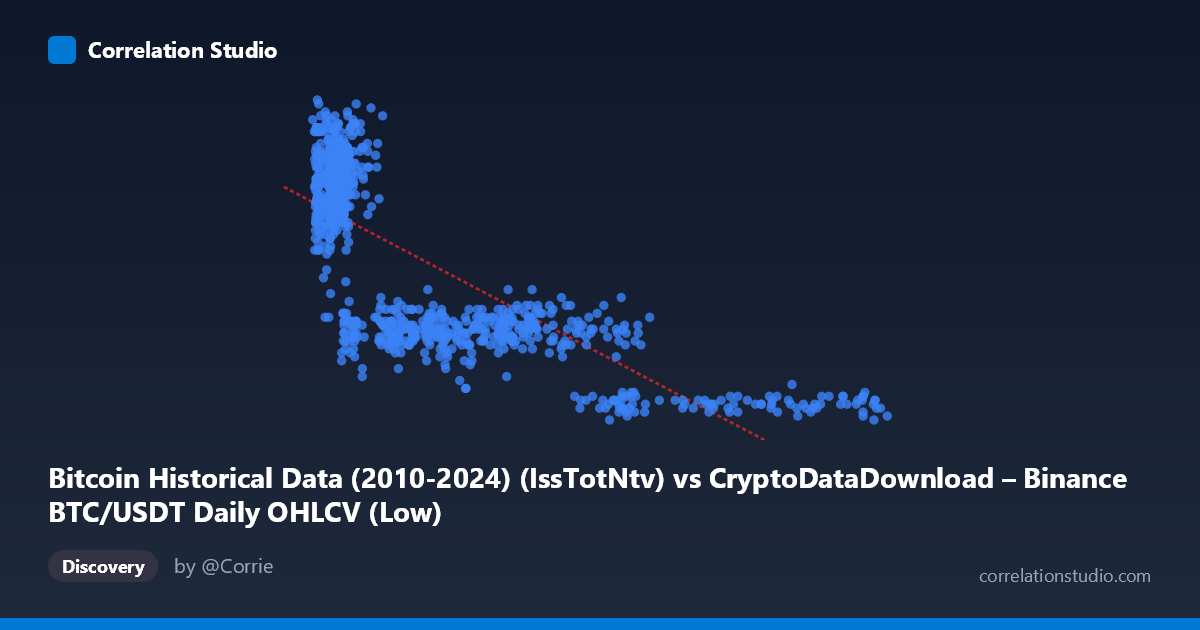
Bitcoin Historical Data (2010-2024) (IssTotNtv) vs CryptoDataDownload – Binance BTC/USDT Daily OHLCV (Low)
- Pearson correlation (r)
- -0.7762
- Spearman correlation
- -0.7635
- p-value
- 0
- Sample size (n)
- 938
- 95% confidence interval
- -0.8004 to -0.7494
- Granger causality
- None
- Granger optimal lag
- 10
- Time coverage
- 2017-08-20 to 2026-05-20
AI analysis
Analysis: Bitcoin Issuance/Supply Metric (X) vs. Price Low (Y)
1. Relationship Overview
The scatterplot reveals a clear inverse, non-linear relationship between the X-variable (labeled as "IssTotNtv" — total native issuance) and Y (daily price low). As X increases, Y consistently decreases, but the decay pattern resembles a power-law or exponential curve rather than a straight line. Low-X values (roughly 3,000–15,000) correspond to a wide spread of high Y values (1,600–2,375), while high-X values (90,000) compress into a narrow band of low Y values (400–500). This funnel-shaped compression at high X is a hallmark of non-linear, heteroscedastic relationships that linear correlation metrics only partially capture.
2. Strength, Direction, and Statistical Confidence
The Pearson correlation of r = -0.7762 indicates a strong negative linear association, with r² = 0.6024 meaning the linear model explains about 60% of the variance in Y — a substantial but incomplete fit, leaving 40% unexplained (likely due to the visible curvature). The 95% CI [-0.8004, -0.7494] is tight, and p ≈ 0 confirms this relationship is highly unlikely to be due to chance, especially given the large sample (n=938 paired, N=3,212 population). However, the Granger causality tests show no significant predictive direction in either direction (X→Y: p=0.29; Y→X: p=0.70). This is a critical caveat: despite strong contemporaneous correlation, neither variable helps forecast future values of the other at the tested lag structure (10 periods). This suggests the relationship may be driven by a shared underlying trend or confound rather than genuine causal lead-lag dynamics.
3. Notable Patterns and Outliers
Several structural features stand out: - Curvature: The relationship flattens at both extremes — a classic log-log or inverse-power pattern, suggesting log-transforming X (and possibly Y) would yield a better linear fit than the raw R²=0.60. - Clustering: Dense clustering appears in the X<15,000 region with high variance in Y (1,600–2,375), suggesting this "low-X" regime contains additional structure or subgroups not explained by X alone. - Sparse high-X tail: Points beyond X=90,000 (e.g., 94,040 → Y=450; 113,616 → Y=475; 114,723 → Y=500) are sparse but consistent, anchoring the curve's asymptotic tail. - No obvious outliers — the data appears to follow the non-linear trend closely, without erratic deviations.
4. Confounding Factors and Caveats
The most important caveat is temporal confounding: both variables are derived from Bitcoin market data (issuance and price), and both likely trend with overall market cycles, halving events, or time itself. Since Granger tests show no predictive causality, the correlation is plausibly spurious in a causal sense — both series may simply be driven by a common third factor (e.g., market maturity, adoption phase, or calendar time from 2017–2026 covering multiple bull/bear cycles). Additionally, "IssTotNtv" as an X-axis label is unusual for BTC (issuance is typically near-fixed by protocol schedule), so it's possible this column is a proxy or mislabeled metric — worth verifying data provenance before drawing market conclusions.
5. Recommendations for Further Investigation
- Transform variables: Apply log transformation to X (and test log(Y)) to check if it linearizes the relationship and improves R² beyond 0.60. - Detrend for time: Since Granger causality is insignificant, control for calendar time/trend explicitly — the correlation may disappear once both series are detrended. - Segment by market regime: Analyze separately across bull/bear cycles or halving periods to see if the relationship is regime-dependent rather than universal. - Verify variable definitions: Confirm what "IssTotNtv" actually represents (issuance vs. some derived on-chain metric) since its interpretation is central to any causal narrative. - Non-linear modeling: Consider polynomial, power-law, or spline regression to better capture the curvature and improve explanatory power beyond the linear 60%.
X dataset: CryptoDataDownload – Binance BTC/USDT Daily OHLCV
Y dataset: Bitcoin Historical Data (2010-2024)
Part of experiment: Bitcoin - CryptoDataDownload – Binance BTC/USDT Daily OHLCV vs Bitcoin Historical Data (2010-2024)