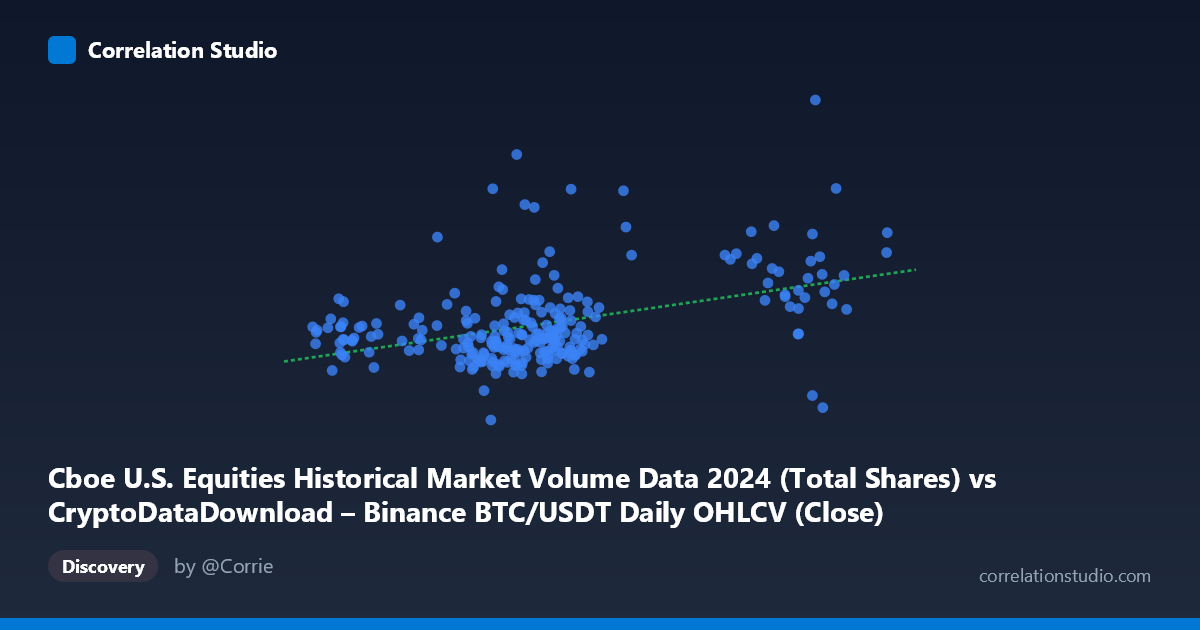
Cboe U.S. Equities Historical Market Volume Data 2024 (Total Shares) vs CryptoDataDownload – Binance BTC/USDT Daily OHLCV (Close)
- Pearson correlation (r)
- 0.4277
- Spearman correlation
- 0.3424
- p-value
- 0
- Sample size (n)
- 252
- 95% confidence interval
- 0.3211 to 0.5236
- Granger causality
- None
- Granger optimal lag
- 10
AI analysis
Analysis: Cboe U.S. Equities Volume vs. Binance BTC/USDT Close Price
1. Relationship Overview
The scatterplot shows a weak-to-moderate positive relationship between U.S. equities market volume (X-axis, mislabeled swap aside—treating axes as given) and BTC/USDT closing prices (Y-axis). Most data points cluster tightly in the X range of 55,000–72,000 with corresponding Y values between roughly 500M and 800M, forming a dense central blob. A smaller number of points extend to higher X values (95,000–106,000), and these tend to correspond to somewhat higher Y values as well, contributing to the overall upward-sloping trend line. However, the scatter within any narrow X band is substantial, indicating that X alone is a poor predictor of Y for individual observations.
2. Strength, Direction, and Statistical Confidence
The correlation coefficient (r = 0.4277) indicates a moderate positive linear relationship, but r² = 0.1829 reveals that only 18.3% of the variance in BTC closing price is explained by equities volume—leaving over 80% attributable to other factors. The 95% CI [0.321, 0.524] is reasonably tight and excludes zero, and the p-value (1.26E-12) confirms this correlation is statistically significant and not due to chance, even though the sample (n=252) is drawn from a larger population (N=3,212)—suggesting the daily pairing likely represents a subsample or aggregation of a higher-frequency dataset. Critically, the Granger causality tests show no significant predictive direction in either direction (X→Y: p=0.213; Y→X: p=0.848) at the tested lag of 10 periods. This means neither variable reliably precedes or forecasts the other in time—the relationship, while statistically real, is likely contemporaneous/correlational rather than causal, possibly driven by shared macro conditions (e.g., overall risk appetite, liquidity cycles, or seasonal trading patterns) rather than one market mechanically driving the other.
3. Patterns, Clusters, and Outliers
The data shows a clear bimodal clustering in the X dimension: a dense cluster around X≈55,000–72,000 and a sparser, distinct cluster around X≈95,000–106,000. This gap suggests two different volume regimes (possibly different months, market conditions, or trading calendar effects like quarter-end volume spikes). Within the main cluster, Y values are noisy and don't show a consistent trend, but the secondary high-X cluster does anchor the regression line's positive slope—meaning the overall correlation may be disproportionately influenced by this smaller subset of high-volume days. Notable outliers include points like (54,018.81, 877,494,760) and (64,143.56, 965,858,506), where BTC price is unusually high relative to typical values at similar X levels, as well as (60,208.58, 379,683,190), the dataset's minimum Y value, sitting in the dense low-X cluster. These outliers likely correspond to BTC's known volatility spikes in 2024 (e.g., ETF approval rallies, halving-related price action) that are largely independent of equities volume.
4. Confounding Factors and Caveats
Several caveats limit causal interpretation. First, spurious correlation risk: both equities volume and BTC price could be driven by common macro factors (interest rate decisions, risk-on/risk-off sentiment, VIX levels) without any direct mechanistic link between Cboe volume and Binance crypto pricing. Second, the N vs. n discrepancy (3,212 vs. 252) suggests aggregation or sampling choices (e.g., every-nth-day sampling, as implied by "every 5th" point listing) that could introduce selection bias or smooth out genuine short-term dynamics. Third, BTC prices exhibit trending, non-stationary behavior over a full year (2024 saw significant appreciation), and regressing a trending price series against volume without differencing/detrending can inflate correlation coefficients artificially. Finally, the two distinct X-clusters may represent different market regimes (e.g., pre/post a specific date), so pooling them into a single linear model may mask more complex, regime-dependent relationships.
5. Actionable Insights and Further Investigation
Given the weak explanatory power (r²=0.18) and lack of Granger causality, this correlation should not be used for predictive trading strategies linking equities volume to BTC price direction. Instead, analysts should: (1) test the relationship using returns/differenced series rather than levels, to control for trending and non-stationarity; (2) segment the analysis by the two apparent X-regimes (normal vs. high equities volume days) to check if the relationship holds independently in each, or if it's an artifact of pooling; (3) investigate what dates correspond to the high-X cluster (95K–106K) to identify if these align with specific market events (e.g., quad-witching, index rebalancing) that might explain both volume spikes and BTC price co-movement; and (4) explore third-variable candidates (e.g., DXY, VIX, or Fed announcement calendars) that could better explain both series simultaneously, potentially via a multivariate regression or vector autoregression (VAR) framework rather than simple pairwise correlation.
X dataset: CryptoDataDownload – Binance BTC/USDT Daily OHLCV
Y dataset: Cboe U.S. Equities Historical Market Volume Data 2024
Part of experiment: Bitcoin - CryptoDataDownload – Binance BTC/USDT Daily OHLCV vs Cboe U.S. Equities Historical Market Volume Data 2024