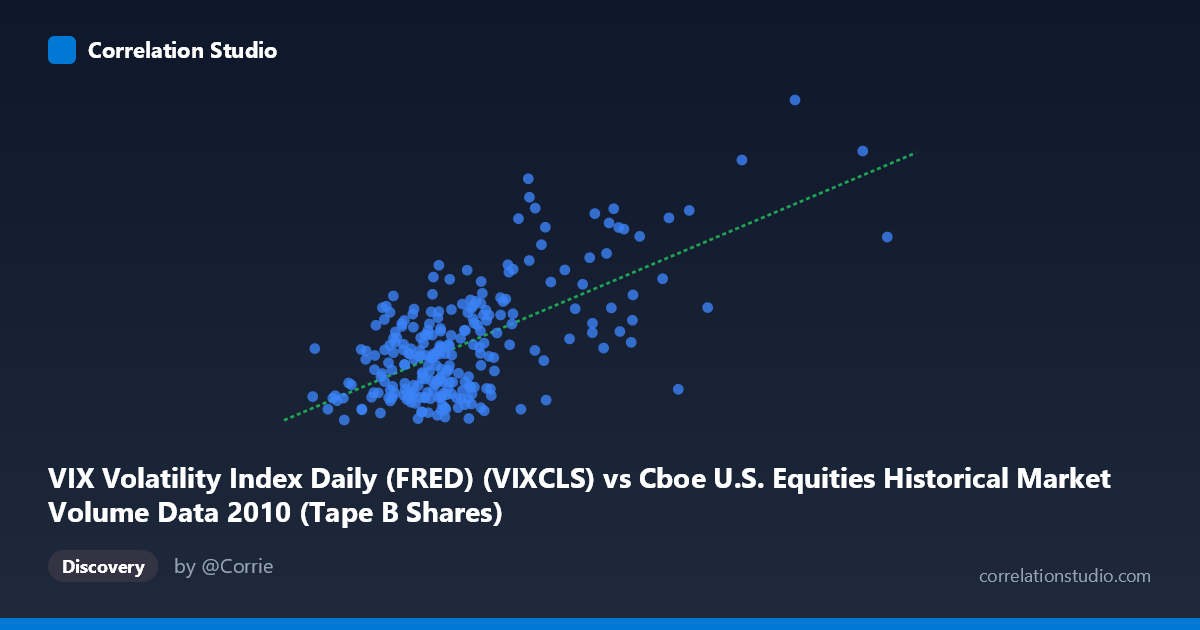
VIX Volatility Index Daily (FRED) (VIXCLS) vs Cboe U.S. Equities Historical Market Volume Data 2010 (Tape B Shares)
- Pearson correlation (r)
- 0.6474
- Spearman correlation
- 0.4745
- p-value
- 0
- Sample size (n)
- 252
- 95% confidence interval
- 0.5694 to 0.7139
- Granger causality
- Y → X
- Granger optimal lag
- 1
AI analysis
Analysis: VIX Volatility Index vs. Cboe Tape B Share Volume (2010)
Relationship Overview
The scatterplot reveals a moderate positive relationship between Cboe U.S. Equities market volume (Tape B Shares, on the X-axis) and the VIX Volatility Index (Y-axis) across 252 trading days in 2010. As daily share volume increases, VIX levels tend to rise correspondingly — a directionally intuitive finding, as periods of market stress and uncertainty typically drive both heightened trading activity and elevated implied volatility. The linear regression equation (y = 7.92×10⁻⁸x + 13.60) suggests that for every one-billion-share increase in Tape B volume, the VIX rises by approximately 0.079 points, with a baseline VIX of roughly 13.6 when volume approaches zero — a theoretically sensible floor given VIX's historical low-volatility baseline.
Correlation Strength and Statistical Significance
The correlation coefficient of r = 0.647 reflects a moderate-to-strong positive association, and the R² of 0.419 indicates that approximately 41.9% of the variance in VIX is explained by Tape B share volume — meaningful, but also a clear signal that the majority (~58%) of VIX variation is driven by factors outside this single volume metric. The 95% confidence interval of [0.569, 0.714] is relatively tight and excludes zero convincingly, and the p-value of effectively 0 across a paired sample of 252 (from a population of 3,302) confirms this is not a chance finding. Critically, the Granger causality analysis points to Y→X (VIX Granger-causes volume) as the statistically significant direction (F = 7.99, p = 0.005), while the reverse direction (X→Y) falls short of significance (F = 3.60, p = 0.059). This implies that past VIX readings are better predictors of future trading volume than the reverse — rising fear precedes trading surges, not the other way around.
Patterns, Clusters, and Outliers
The scatterplot exhibits several notable structural features. The bulk of observations cluster in a lower-left region — roughly VIX values of 15–25 and volume below 150 million shares — consistent with the relatively calm stretches of 2010 trading following the post-crisis stabilization. However, there is a visible upper-right tail of high-volume, high-VIX days, with points like (316M shares, ~41 VIX) and (255M shares, ~40 VIX) standing out as potential outliers or leverage points. These likely correspond to specific stress episodes in 2010, most plausibly the May 2010 "Flash Crash" and surrounding European sovereign debt contagion fears, which drove simultaneous spikes in both volume and implied volatility. There also appear to be cases of elevated VIX (~30–38) at relatively modest volume levels (around 136–147M shares), suggesting VIX can spike without extraordinary volume — possibly on gap-open fear events or low-liquidity stress days.
Confounding Factors and Caveats
Several important caveats temper this interpretation. First, Tape B volume is only one segment of total U.S. equity market volume (covering NYSE American, regional exchanges, and related TRFs), so the relationship may differ if total consolidated volume were used. Second, both VIX and equity volume are known to be influenced by common third variables — macroeconomic announcements, Federal Reserve communications, earnings seasons, and geopolitical shocks — which could be inflating the observed correlation spuriously. Third, 2010 was an atypical year marked by the Flash Crash and ongoing European debt crisis headlines; findings may not generalize to other market regimes. Finally, because VIX is a forward-looking implied volatility measure while volume is a realized transaction metric, the causal framing requires care: the Granger result suggests VIX leads volume temporally at a 1-period lag, but Granger causality does not establish structural economic causation.
Actionable Insights and Further Investigation
For practitioners, the finding that VIX Granger-causes volume at a 1-period lag has practical trading relevance: elevated VIX readings may serve as a reliable early signal for anticipating surges in next-day Tape B trading activity, which could inform market-making inventory management, execution scheduling, or liquidity provision strategies. Researchers should consider extending the analysis to the full 3,302-observation population rather than the 252-day sample to confirm robustness, and should test non-linear specifications (e.g., log-log or polynomial regression) given the apparent heteroscedasticity in the scatterplot — variance in VIX appears to fan out at higher volume levels. Decomposing the data by VIX regime (e.g., sub-20 vs. 20–30 vs. 30+) may reveal whether the correlation strengthens meaningfully during stress periods. Incorporating additional volume tapes (Tape A and C) and controlling for day-of-week effects, option expiration cycles, and macro announcement calendars would substantially sharpen the causal inference.
X dataset: Cboe U.S. Equities Historical Market Volume Data 2010
Y dataset: VIX Volatility Index Daily (FRED)
Part of experiment: Daily - Cboe U.S. Equities Historical Market Volume Data 2010 vs VIX Volatility Index Daily (FRED)