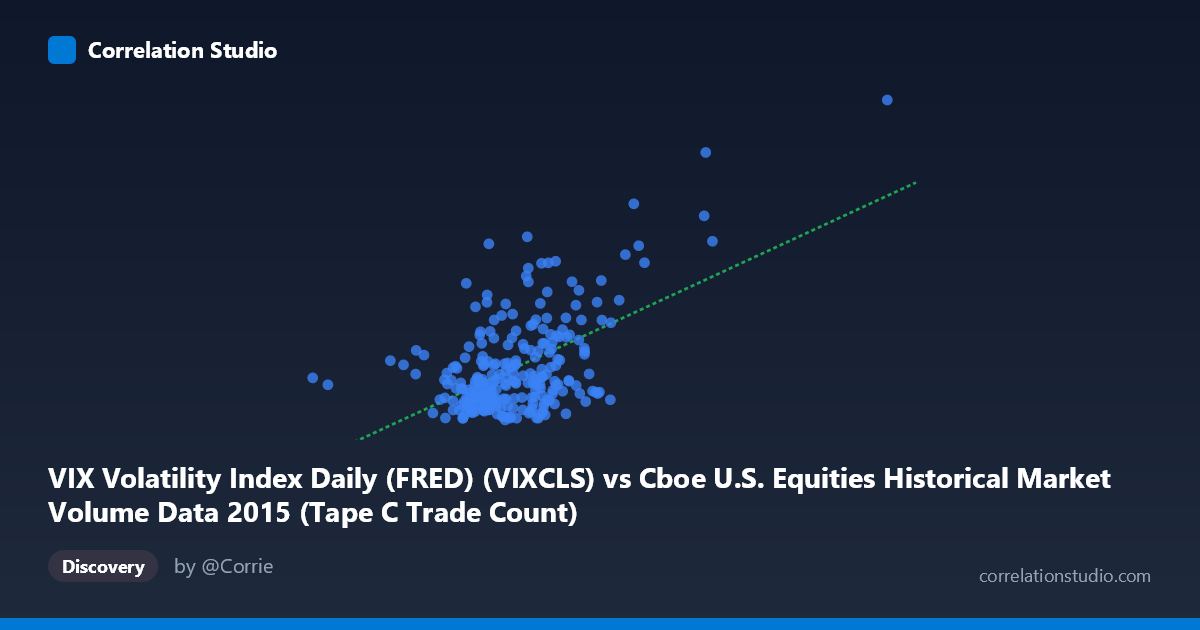
VIX Volatility Index Daily (FRED) (VIXCLS) vs Cboe U.S. Equities Historical Market Volume Data 2015 (Tape C Trade Count)
- Pearson correlation (r)
- 0.5495
- Spearman correlation
- 0.3537
- p-value
- 0
- Sample size (n)
- 252
- 95% confidence interval
- 0.457 to 0.6303
- Granger causality
- None
- Granger optimal lag
- 1
AI analysis
Analysis: VIX Volatility Index vs. Cboe Tape C Trade Count (2015)
Relationship Overview The scatterplot reveals a moderate positive relationship between the VIX Volatility Index and Cboe Tape C trade counts across 252 trading days in 2015. As market volatility (VIX) increases, the number of trades on Tape C venues tends to rise correspondingly. This is an intuitively sensible finding — periods of heightened fear or uncertainty typically drive elevated trading activity as investors reposition, hedge, or liquidate positions. The linear regression equation (y = 1.81×10⁻⁵x + 2.98) confirms the positive slope, though the relatively modest coefficient suggests the relationship, while real, is far from deterministic.
Correlation Strength and Statistical Significance The Pearson correlation of r = 0.55 indicates a moderate positive association, but the explanatory power is more sobering: r² = 0.302 means only ~30% of variance in Tape C trade counts is explained by VIX levels, leaving roughly 70% attributable to other factors. The 95% confidence interval of [0.457, 0.630] is meaningfully bounded away from zero, and the p-value of effectively 0 confirms this is not a chance artifact given the sample of 252 observations drawn from a population of 3,302 data points. However, the Granger causality results are notably absent — neither direction (X→Y: F=0.05, p=0.82; Y→X: F=0.13, p=0.72) reaches significance at even a lenient threshold. This means that despite the contemporaneous correlation, past VIX values do not predict future trade counts, and vice versa — the relationship is associative rather than temporally predictive, which materially limits its use in forecasting models.
Notable Patterns, Clusters, and Outliers The scatter of sample points reveals several important structural features. The bulk of observations cluster in a relatively dense band between VIX values of roughly 11–20 and trade counts of 600,000–900,000, suggesting these represent "normal" 2015 market conditions. However, there are clear high-leverage outliers at elevated VIX levels — notably the points near (1,194,527, 36.02) and (1,210,005, 28.03) — which correspond to periods of acute market stress (likely the August 2015 volatility spike). These extreme observations may be disproportionately driving the correlation. Additionally, there appears to be heteroscedasticity: variance in trade counts fans outward at higher VIX values, suggesting the relationship is less stable during turbulent periods, which undermines the assumptions of simple linear regression.
Confounding Factors and Caveats Several important caveats temper interpretation. First, 2015 is a single calendar year capturing one specific market regime — findings may not generalize across different volatility regimes or structural market changes. Second, Tape C trade count reflects only one reporting tape (primarily NYSE Arca-listed securities), so it may be capturing venue-specific routing behavior rather than broad market activity. Third, day-of-week effects, earnings seasons, options expiration cycles, and macroeconomic announcements are likely confounders that simultaneously influence both VIX and trading volumes. Fourth, the X and Y axis labels appear to be swapped in the dataset metadata (VIX is listed as the Y-axis source dataset and vice versa), warranting a data hygiene review before drawing firm conclusions. Finally, correlation at this temporal granularity (daily) may reflect coincident reactions to common external shocks rather than a structural causal mechanism.
Actionable Insights and Further Investigation Practitioners could use the VIX–volume relationship as a regime indicator — elevated VIX periods (25) appear reliably associated with trade count spikes, which has implications for exchange capacity planning, liquidity provision strategies, and transaction cost modeling. However, given the failed Granger causality tests, VIX should not be used in isolation as a lead indicator for next-day trading volumes. Further investigation should include: (1) testing non-linear specifications (e.g., log-log or piecewise regression) given the apparent heteroscedasticity; (2) expanding the analysis across multiple years to test regime stability; (3) controlling for options expiration dates and scheduled macro events; (4) comparing Tape A and Tape B trade counts to assess whether the relationship is venue-specific; and (5) applying rolling-window correlations to identify whether the r=0.55 relationship is stable or concentrated in specific stress episodes like August 2015.
X dataset: Cboe U.S. Equities Historical Market Volume Data 2015
Y dataset: VIX Volatility Index Daily (FRED)
Part of experiment: Daily - Cboe U.S. Equities Historical Market Volume Data 2015 vs VIX Volatility Index Daily (FRED)