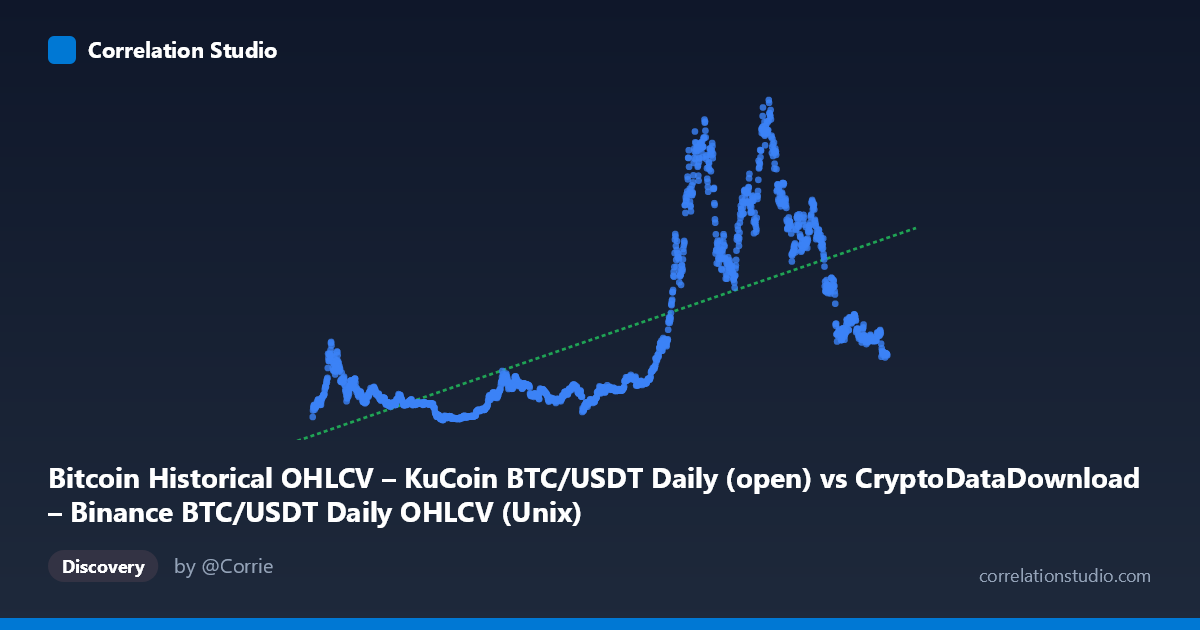
Bitcoin Historical OHLCV – KuCoin BTC/USDT Daily (open) vs CryptoDataDownload – Binance BTC/USDT Daily OHLCV (Unix)
- Pearson correlation (r)
- 0.6754
- Spearman correlation
- 0.7549
- p-value
- 0
- Sample size (n)
- 1861
- 95% confidence interval
- 0.6499 to 0.6993
- Granger causality
- None
- Granger optimal lag
- 10
AI analysis
Analysis of Bitcoin Price Time Series Correlation
1. What the Visualization Reveals
This scatterplot is fundamentally a time-series-as-scatterplot, where the X-axis (Unix timestamp) is simply the passage of time, and Y is BTC/USDT price. Despite being labeled as two "different" datasets (Binance open price vs. KuCoin Unix timestamp), the underlying structure indicates X is effectively a date index and Y is Bitcoin's price trajectory. The chart therefore doesn't show a relationship between two independent market variables — it shows Bitcoin's price evolution from late 2017 through late 2022, capturing the boom, bust, and re-boom cycles of that period (the run to ~$20K in 2017-18, the 2018-19 crash to ~$3.2K, the 2020-21 bull run to ~$67.5K, and the 2022 decline).
2. Strength, Direction, and Statistical Interpretation
The correlation (r = 0.675, r² = 0.456) indicates a moderate positive relationship, meaning roughly 46% of the variance in Y is "explained" by X — but since X is just time, this really just says that price has trended upward over the five-year window in a way that's imperfectly linear. The 95% CI [0.650, 0.699] is tight and excludes zero, and the p-value (effectively 0) confirms this is statistically robust — unsurprising given n=1,861 sequential, highly autocorrelated observations. However, the Granger causality results are the most important caveat: neither direction shows significant predictive causality (X→Y: p=0.089; Y→X: p=0.878). This makes sense because X (time/timestamp) cannot be "caused" by price, and this test result underscores that the correlation is descriptive of a trend, not evidence of any predictive or causal mechanism between two independent economic variables.
3. Notable Patterns and Non-Linear Features
The relationship is strongly non-linear and non-monotonic, which is why r² is only moderate despite an obvious visual trend. Key features include: - Multiple regime clusters: a low, flat cluster (~$3.2K–$10K) spanning 2018–2020, a steep ramp to ~$45K–$65K in 2020–2021, and a partial pullback/plateau (~$19K–$48K) through 2022. - A sharp inflection/breakout around early-to-mid 2020, where price transitions from a multi-year accumulation range into a parabolic rally — this is the single largest driver of the "positive slope" the linear model detects. - Local peaks and volatility: values near 56,000–67,500 (early-to-mid 2021) followed by drops back to the 29,000–44,000 range show cyclical boom-bust behavior rather than steady linear growth. - The linear regression line (y = 2.46e-07x − 371,384) is a poor descriptor of this cyclical structure — a piecewise or log-linear model would fit far better.
4. Confounding Factors and Caveats
The biggest caveat is that this isn't really a bivariate correlation between independent phenomena — it's a price series indexed by time, and "time" has no causal relationship with price; it merely orders the observations. Standard correlation/regression assumptions (independent, identically distributed errors) are violated because financial time series exhibit strong autocorrelation, volatility clustering, and regime-switching behavior. Additionally, X and Y being sourced from two different exchanges (Binance vs. KuCoin) for essentially the same underlying asset raises questions about whether this pairing is a data artifact (e.g., timestamp column mislabeled as a value column) rather than an intentional cross-asset comparison. Macro factors (interest rates, regulatory news, halving cycles, exchange-specific liquidity) are the true drivers of BTC price and are entirely absent from this simple time-indexed model.
5. Suggestions for Further Investigation
- Clarify the variable definitions: confirm whether X is genuinely meant to be a timestamp/index or whether this was intended as a cross-exchange price comparison (Binance open vs. KuCoin close), since the current framing conflates "time" with "price." - If time-series analysis is the goal, use appropriate methods: log-transform price, apply ARIMA/GARCH models to handle autocorrelation and volatility clustering, and test stationarity (ADF test) before regression. - If cross-exchange comparison is intended, correlate Binance and KuCoin prices directly (not timestamp vs. price) to check for arbitrage gaps or lead-lag effects between exchanges, which would be a much more meaningful Granger causality test. - Segment by market regime (bear/bull/accumulation phases) to build more accurate piecewise models rather than a single global linear fit, since r² = 0.46 substantially understates the strength of within-regime trends.
X dataset: CryptoDataDownload – Binance BTC/USDT Daily OHLCV
Y dataset: Bitcoin Historical OHLCV – KuCoin BTC/USDT Daily
Part of experiment: Bitcoin - CryptoDataDownload – Binance BTC/USDT Daily OHLCV vs Bitcoin Historical OHLCV – KuCoin BTC/USDT Daily