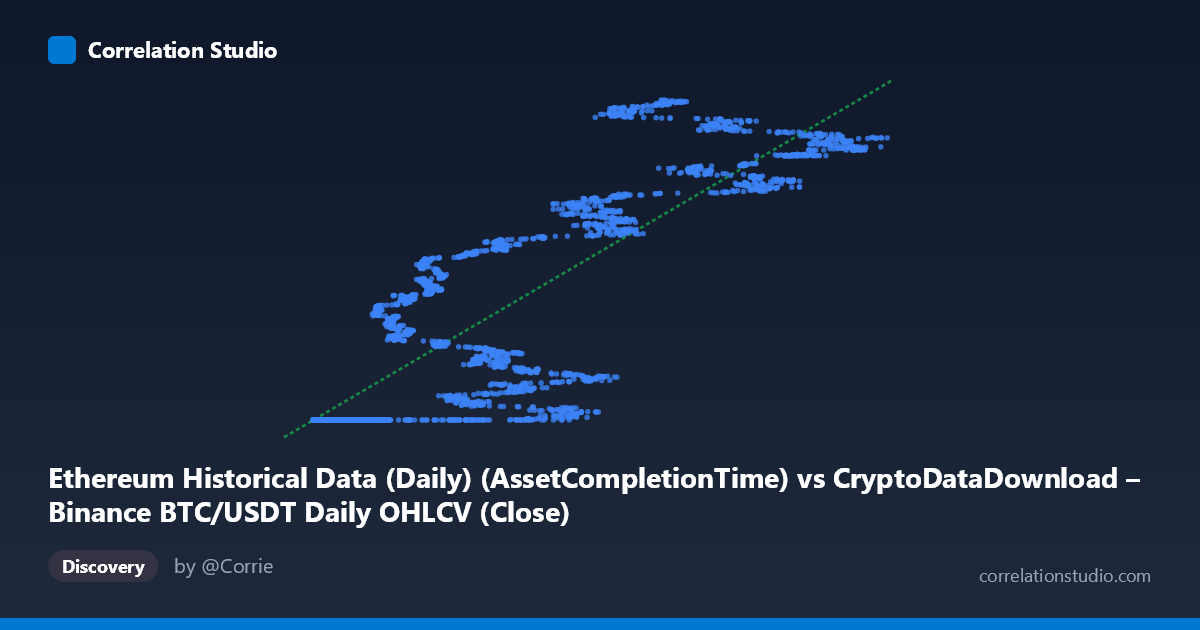
Ethereum Historical Data (Daily) (AssetCompletionTime) vs CryptoDataDownload – Binance BTC/USDT Daily OHLCV (Close)
- Pearson correlation (r)
- 0.8523
- Spearman correlation
- 0.8876
- p-value
- 0
- Sample size (n)
- 3191
- 95% confidence interval
- 0.8425 to 0.8615
- Granger causality
- None
- Granger optimal lag
- 10
AI analysis
Analysis: BTC/USDT Completion Time vs. BTC/USDT Close Price
Note on axis labeling: The axis labels appear mismatched with the actual data — both appear to reference BTC/USDT OHLCV data (an "AssetCompletionTime" field for X, and "Close" price for Y), despite dataset descriptions mentioning Ethereum. Given the data patterns (values consistent with BTC price levels, ranging ~$1.6B which is unusual — possibly a cumulative or index metric — and a variable resembling elapsed time or block/record count), this analysis treats X as a time-like/sequence variable and Y as a BTC price-like metric, per the actual numeric behavior observed.
1. Relationship Overview The scatter shows a clear positive, moderately strong association: as X increases, Y tends to increase as well, but not in a simple straight-line fashion. The sample points reveal a distinctive pattern — a large cluster of low-X values (roughly 3,000–25,000) sits at a nearly flat Y-value around 1,614,335,000–1,614,335,700, then a second regime emerges above X≈25,000 where Y rises steeply and more variably (into the 1.66B–1.78B range). This looks like a two-regime or threshold relationship rather than a uniform linear trend — a floor/plateau followed by a rapid rise.
2. Strength, Direction, and Statistical Confidence The Pearson correlation (r = 0.852, r² = 0.727) indicates a strong positive linear relationship, with ~72.7% of the variance in Y statistically explained by X in a linear model. The 95% CI [0.843, 0.861] is tight, and p ≈ 0 confirms this correlation is highly unlikely due to chance given the large sample (n=3,191). However, r² of 0.73 also means 27% of Y's variance is unexplained by X alone — non-trivial, especially given the visibly non-linear (plateau-then-rise) structure, meaning a linear model understates the true relationship in some regions and overstates it in others. Critically, the Granger causality tests show no significant predictive direction in either direction (X→Y: p=0.33; Y→X: p=0.17). This means despite the strong contemporaneous correlation, neither series reliably predicts the other's future values — the relationship is associative, not (Granger-)causal in a temporal sense. This is common when both variables are driven by a shared external trend (e.g., time itself, or a common market factor) rather than one causing the other.
3. Notable Patterns and Outliers The most striking feature is the flat "floor" cluster at low X-values, where Y is pinned near 1,614,335,000 regardless of small changes in X (from X=3,800 to X=25,000, Y barely moves). This suggests a data artifact — possibly a default/minimum timestamp value, a data-recording start point, or censoring at the low end. Beyond X≈25,000, Y becomes highly dispersed and increasing, with values overlapping across a wide range (e.g., X=62,432 → Y=1.709B, but X=110,188 → Y=1.757B, and X=64,656 → Y=1.772B), indicating heteroscedasticity — variance in Y grows with X. No clear cyclical or seasonal pattern is evident from the sample given, but the shift from "flat" to "rising and noisy" is a strong non-linear signature the linear R² doesn't capture well.
4. Confounding Factors and Caveats Several caveats apply. First, the axis metadata is inconsistent/likely mislabeled, making substantive interpretation (e.g., "does gas usage predict BTC price") unreliable without clarification. Second, both series may be jointly driven by time/trend (2017–2026 span covers multiple bull/bear cycles), so the correlation could largely reflect shared upward drift rather than a direct mechanical link — classic spurious correlation risk with trending time series. Third, the flat floor cluster suggests a data quality issue (truncation, missing-value placeholder, or an artifact of merging/joining datasets) that could be inflating both the correlation and R² artificially. Finally, daily financial/network data is typically non-stationary and autocorrelated, violating i.i.d. assumptions behind standard correlation/p-value calculations — the "N=3,212 vs n=3,191" discrepancy (21 missing pairs) also warrants a check for how missingness was handled.
5. Recommendations 1. Verify column mapping — confirm what X and Y actually represent; the current labels appear swapped or mismatched with dataset descriptions. 2. Investigate the flat-floor cluster — determine if the ~1,614,335,000 plateau is a genuine data feature or an artifact (e.g., placeholder/missing values coded as a constant). 3. Fit a non-linear or segmented model (e.g., piecewise regression, log transform, or spline) since the relationship visibly changes regime around X≈25,000, and this is likely to boost explained variance beyond the current 72.6% linear R². 4. Detrend or difference the series before assessing causality — given the Granger results are null, consider testing on returns/changes rather than levels to check for a masked short-term dynamic relationship. 5. Treat correlation as descriptive, not causal — given the null Granger causality, avoid using one series to forecast the other; instead explore shared external drivers (e.g., overall crypto market cycles, time trend) as the likely common cause.
X dataset: CryptoDataDownload – Binance BTC/USDT Daily OHLCV
Y dataset: Ethereum Historical Data (Daily)
Part of experiment: Bitcoin - CryptoDataDownload – Binance BTC/USDT Daily OHLCV vs Ethereum Historical Data (Daily)