VIX Volatility Index Daily (FRED) (VIXCLS) vs Cboe U.S. Equities Historical Market Volume Data 2010 (Tape A Shares)
- Pearson correlation (r)
- 0.4653
- Spearman correlation
- 0.233
- p-value
- 0
- Sample size (n)
- 252
- 95% confidence interval
- 0.3626 to 0.5569
- Granger causality
- Y → X
- Granger optimal lag
- 1
AI analysis
Analysis: VIX Volatility Index vs. Cboe U.S. Equities Market Volume (Tape A Shares) — 2010
Relationship Overview
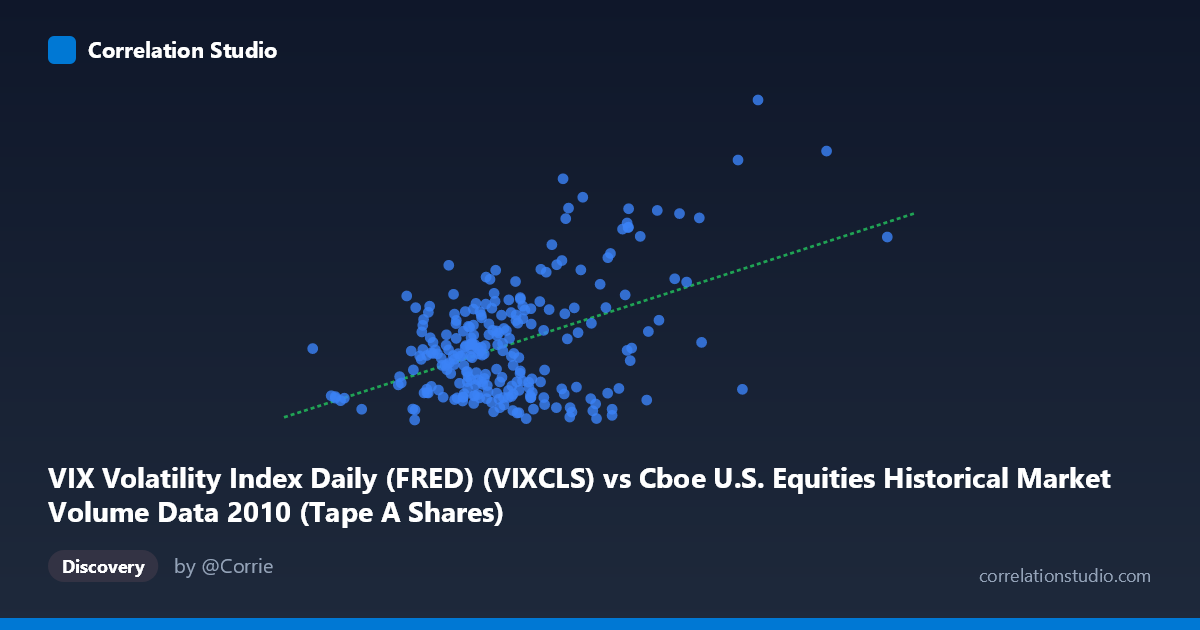
The scatterplot reveals a moderate positive relationship between U.S. equity market trading volume (X-axis: Cboe market volume, notional value) and the VIX Volatility Index (Y-axis). As daily trading volume increases, VIX levels tend to rise, which aligns intuitively with market microstructure theory: elevated fear and uncertainty drive both heightened trading activity and higher implied volatility simultaneously. The linear regression equation (y = 2.237×10⁻⁸x + 14.17) confirms the positive slope, with a baseline VIX estimate of ~14.2 at minimal volume levels — consistent with the relatively calm floor of 2010 market conditions following the post-2008 stabilization period.
Correlation Strength and Statistical Significance
The Pearson correlation of r = 0.4653 indicates a moderate positive association, but the explanatory power is meaningfully limited: r² = 0.2165 means only ~21.7% of VIX variance is explained by trading volume, leaving roughly 78% attributable to other factors. The 95% confidence interval of [0.363, 0.557] is reasonably narrow given n = 252 paired observations drawn from a population of N = 3,302, suggesting stable estimation. The p-value of 5.995×10⁻¹⁵ is overwhelmingly significant, firmly rejecting the null hypothesis of no linear relationship. Crucially, the Granger causality results establish a unidirectional temporal dynamic: Y (VIX) Granger-causes X (volume) at lag 1 (F = 5.81, p = 0.017), while the reverse direction fails to reach significance (F = 1.93, p = 0.166). This suggests that VIX movements today tend to predict trading volume the following period, not the other way around — fear leads activity, not vice versa.
Notable Patterns, Clusters, and Outliers
The scatterplot exhibits several visually distinct features. The bulk of observations cluster in the lower-left quadrant (volume roughly 200M–450M, VIX 15–25), representing typical 2010 trading days during relative market calm. A secondary, sparser cluster emerges in the upper-right region (volume 500M, VIX 30–40), likely corresponding to episodic stress events — most notably the May 2010 Flash Crash and surrounding European sovereign debt contagion fears, which drove VIX above 40 and volume to extremes. Several notable outliers, including points near (812M, 41) and (690M, 40), stand well apart from the central mass and likely exert disproportionate influence on the regression slope. The relationship also appears to display heteroscedasticity: variance in VIX widens considerably at higher volume levels, suggesting the linear model may underfit the tails.
Confounding Factors and Interpretive Caveats
Several important caveats temper straightforward causal interpretation. First, both variables are jointly driven by common macro shocks (e.g., news events, Fed communications, geopolitical developments), making shared causation from a third variable the most likely explanation for much of the observed correlation. Second, 2010 was a structurally unusual year — it contained the Flash Crash (May 6), post-crisis recovery dynamics, and the early European debt crisis, all of which compress what might otherwise be a more diffuse multi-year relationship into a specific regime. Third, the X-axis variable represents notional volume, which can be inflated by high-frequency trading activity that may not reflect genuine sentiment-driven participation. Finally, while Granger causality suggests VIX leads volume, this is a predictive, not mechanistic, causal claim — it could reflect options market participants positioning ahead of anticipated volatility events that subsequently drive equity trading.
Actionable Insights and Further Investigation
Practitioners and researchers should consider several follow-up directions. Given that VIX Granger-causes volume, VIX could serve as a useful leading indicator for intraday or next-day volume forecasting models in equity market microstructure applications. However, the 78% unexplained variance strongly argues for a multivariate modeling approach incorporating additional predictors such as S&P 500 returns, macro announcement schedules, options expiration calendars, and market breadth indicators. It would be valuable to replicate this analysis across multiple years to test whether the 2010 regime (post-crisis, Flash Crash) produces an atypically strong relationship compared to calmer periods. Additionally, segmenting the data by volatility regime (e.g., VIX < 20 vs. ≥ 20) could reveal whether the relationship is largely driven by stress episodes, which would have important implications for risk management and liquidity provisioning strategies. A non-linear (e.g., polynomial or spline) regression should also be explored given the apparent heteroscedasticity in the upper tail.
X dataset: Cboe U.S. Equities Historical Market Volume Data 2010
Y dataset: VIX Volatility Index Daily (FRED)
Part of experiment: Daily - Cboe U.S. Equities Historical Market Volume Data 2010 vs VIX Volatility Index Daily (FRED)