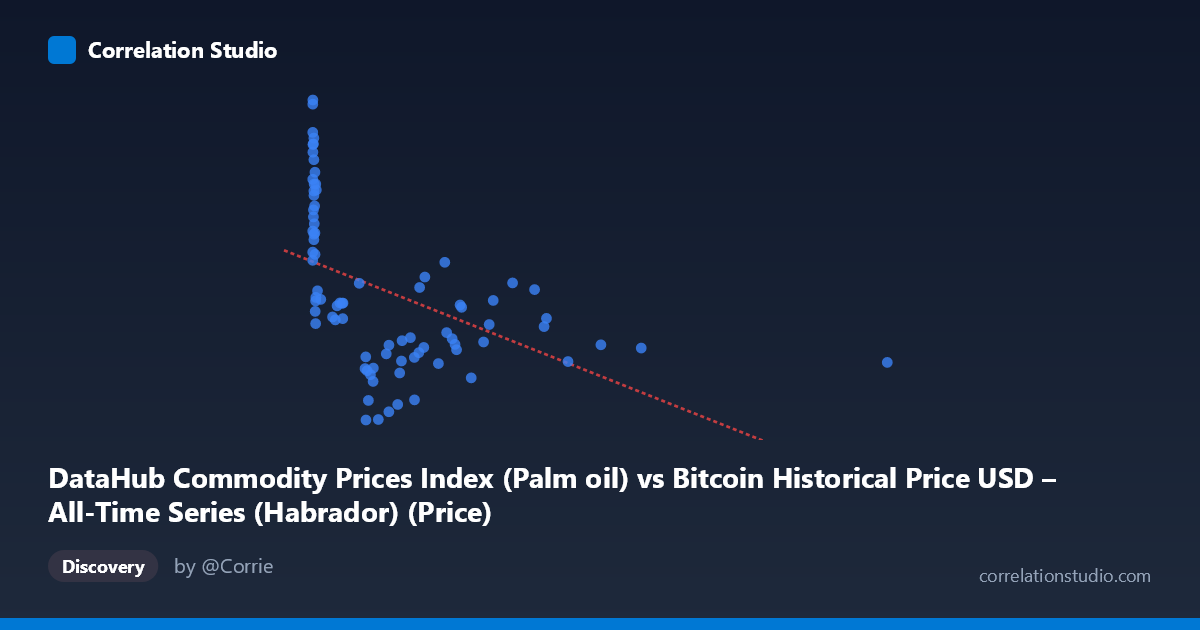
DataHub Commodity Prices Index (Palm oil) vs Bitcoin Historical Price USD – All-Time Series (Habrador) (Price)
- Pearson correlation (r)
- -0.4742
- Spearman correlation
- -0.6738
- p-value
- 0.000006
- Sample size (n)
- 83
- 95% confidence interval
- -0.6259 to -0.288
- Granger causality
- None
- Granger optimal lag
- 10
AI analysis
Scatterplot Analysis: Palm Oil Price Index vs. Bitcoin Historical Price
1. Overall Relationship The scatterplot reveals a moderate negative, non-linear relationship between the palm oil commodity index (X) and Bitcoin price (Y). Most data points cluster tightly at low X values (under 300), with Y values ranging widely from roughly 500 to 1250. As X increases beyond this cluster, Y values compress into a narrower, lower band (approximately 600–850), producing a downward-sloping fan or decay-curve pattern rather than a linear trend.
2. Strength, Direction, and Uncertainty The Pearson correlation (r = -0.474) indicates a moderate negative association, with r² = 0.225 meaning only about 22.5% of the variance in Bitcoin price is statistically explained by palm oil prices — leaving over three-quarters of variance driven by other factors. The 95% CI [-0.626, -0.288] is reasonably tight and excludes zero, and the p-value (5.94E-06) is highly significant, confirming the correlation is not due to chance. However, statistical significance here reflects sample size and data structure, not necessarily strength or causal relevance — r² remains low. Critically, the Granger causality tests show no significant predictive direction in either direction (X→Y: p=0.445; Y→X: p=0.323), meaning past values of one series do not help forecast the other. This strongly suggests the correlation is contemporaneous or coincidental rather than reflecting a genuine lead-lag economic relationship.
3. Notable Patterns and Outliers The most striking feature is data density: the majority of points sit in the X < 300 region, forming a vertical band with high Y variance (500–1250) — this is where Bitcoin's early volatile price history resides. A smaller, more dispersed set of points at X 600 (up to 2452) shows compressed, lower Y values (620–800), consistent with a later, calmer Bitcoin price era. This creates the appearance of correlation but may simply reflect two different time regimes (early volatile Bitcoin years vs. later stabilization) rather than a functional dependency on palm oil. The suggested non-linear fit (Spearman Pearson) supports a decay/logarithmic curve better than a straight line — likely driven by this two-regime clustering rather than true curvature in the relationship itself.
4. Confounding Factors and Caveats This is almost certainly a spurious or confounded correlation driven by shared time trends rather than any economic mechanism linking palm oil prices to Bitcoin. Both series are time-ordered (2010–2017), and Bitcoin's price during this period exhibited its own explosive, non-stationary growth pattern independent of commodity markets. Any two non-stationary time series can show artificial correlation purely from trending in opposite general directions over time. Additionally, small sample size (n=83) relative to population (449) invites concern about sampling representativeness, and no adjustment for autocorrelation within each series was made — a serious issue given both are time-series data.
5. Recommendations for Further Investigation Rather than treating this as a meaningful bivariate relationship, analysts should: (1) test for stationarity (e.g., ADF test) in both series and consider differencing before correlation analysis; (2) explore whether a third variable (e.g., overall macroeconomic conditions, USD strength, or time itself) drives both series independently; (3) segment the analysis by Bitcoin's distinct market regimes (2010–2013 vs. 2014–2017) to check if the correlation holds within each subperiod or only appears when regimes are pooled; and (4) given the null Granger causality result, avoid using palm oil prices as a predictive feature for Bitcoin price forecasting models. This pairing appears to be a statistical curiosity rather than an economically actionable signal.
X dataset: Bitcoin Historical Price USD – All-Time Series (Habrador)
Y dataset: DataHub Commodity Prices Index
Part of experiment: Bitcoin - Bitcoin Historical Price USD – All-Time Series (Habrador) vs DataHub Commodity Prices Index