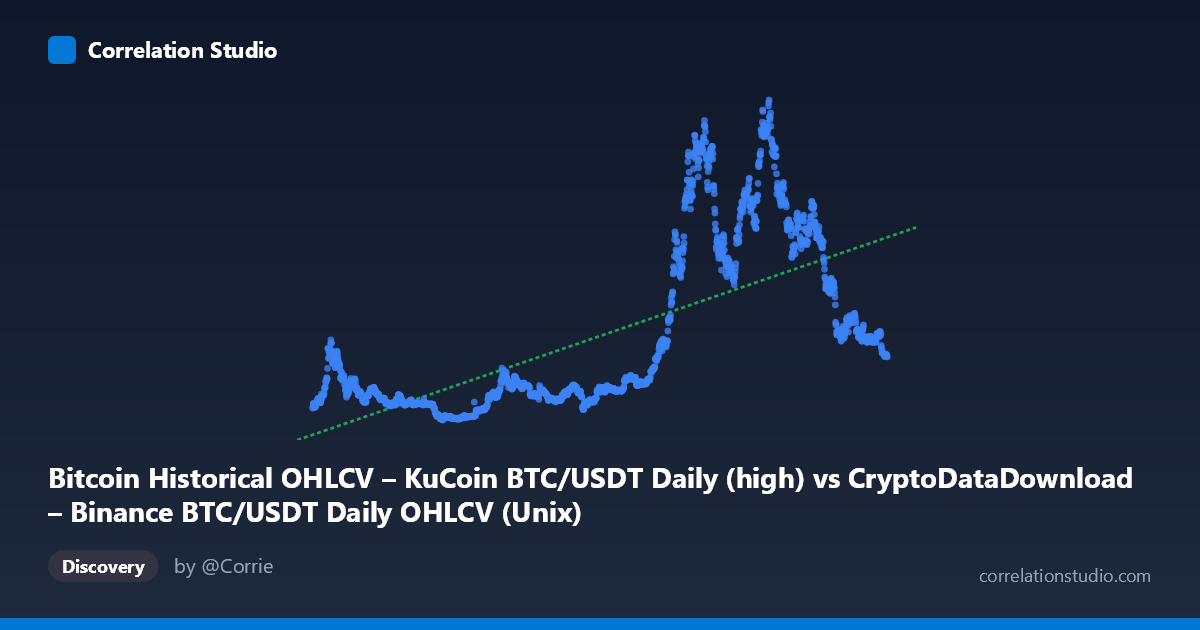
Bitcoin Historical OHLCV – KuCoin BTC/USDT Daily (high) vs CryptoDataDownload – Binance BTC/USDT Daily OHLCV (Unix)
- Pearson correlation (r)
- 0.6716
- Spearman correlation
- 0.7488
- p-value
- 0
- Sample size (n)
- 1861
- 95% confidence interval
- 0.6459 to 0.6958
- Granger causality
- None
- Granger optimal lag
- 10
- Time coverage
- 2017-10-19 to 2022-11-29
AI analysis
Analysis: BTC/USDT Price vs. Time (Binance/KuCoin OHLCV)
1. What the Visualization Reveals
This scatterplot is essentially tracking Bitcoin's price trajectory over time (2017–2022), with the X-axis being a Unix timestamp and Y-axis being BTC price (high values from a near-identical OHLCV dataset). The "correlation" here is less a relationship between two independent economic variables and more a reflection of Bitcoin's long-term secular price growth — a non-stationary trend that inherently correlates with time due to the asset's historical bull-market appreciation.
2. Strength, Direction, and Statistical Meaning
The correlation (r = 0.672, r² = 0.451) indicates a moderate-to-strong positive relationship, with time explaining about 45% of the variance in price. The narrow 95% CI [0.646, 0.696] and p-value of ~0 confirm this relationship is highly statistically reliable (unsurprising given N=1,861 daily observations) — but statistical significance here mostly reflects the strong autocorrelation and trending nature of price/time data rather than a meaningful causal link. Notably, the Granger causality test found no significant predictive direction in either direction (X→Y: p=0.087; Y→X: p=0.868). This is expected since X and Y are nearly the same underlying variable (BTC price) sourced from two different exchanges/datasets — time cannot "Granger-cause" price in a classic sense, and the near-duplicate series don't predict each other beyond their shared trend.
3. Notable Patterns and Non-Linear Features
The scatter clearly shows Bitcoin's characteristic boom-bust cycles rather than a clean linear trend: - A prolonged basing/accumulation phase (2018–2020) with prices under $10K - An explosive parabolic rally in 2020–2021, peaking near $69K (late 2021) - A sharp correction/decline through 2022, settling around $19–20K
This is a classic non-linear, multi-cycle pattern — the linear R² of 45% substantially understates the fit quality within regime periods and overstates it when averaged across the entire cyclical structure. A polynomial, logarithmic, or piecewise regression would likely capture the shape far better than a single linear model.
4. Confounding Factors and Caveats
The most critical caveat: X and Y appear to be measuring the same underlying asset price (BTC/USDT high) from two nearly identical data sources (Binance and KuCoin), just possibly offset or mislabeled in this comparison — this is not two independent phenomena being correlated but likely redundant/overlapping data. Any "correlation" is mechanically driven by shared market movements, not causal interaction. Additionally, treating time as a regressor ignores the non-stationarity of price series, macro liquidity cycles (Fed policy, COVID stimulus), halving cycles, and exchange-specific volume/liquidity differences that could cause minor divergences between platforms.
5. Suggested Further Investigation
- Clarify data provenance: confirm whether X and Y are truly distinct series or duplicated/mislabeled columns from the same market. - If distinct exchanges: analyze spread/basis between Binance and KuCoin prices to detect arbitrage opportunities, lead-lag microstructure effects, or liquidity premiums — rather than raw price correlation. - Apply log-price transformation and differencing (returns) to remove trend/non-stationarity before correlation or Granger tests — this would yield more meaningful causality results. - Segment analysis by market regime (bull/bear/consolidation) rather than the full 5-year span to avoid conflating structural breaks with a single linear relationship.
X dataset: CryptoDataDownload – Binance BTC/USDT Daily OHLCV
Y dataset: Bitcoin Historical OHLCV – KuCoin BTC/USDT Daily
Part of experiment: Bitcoin - CryptoDataDownload – Binance BTC/USDT Daily OHLCV vs Bitcoin Historical OHLCV – KuCoin BTC/USDT Daily