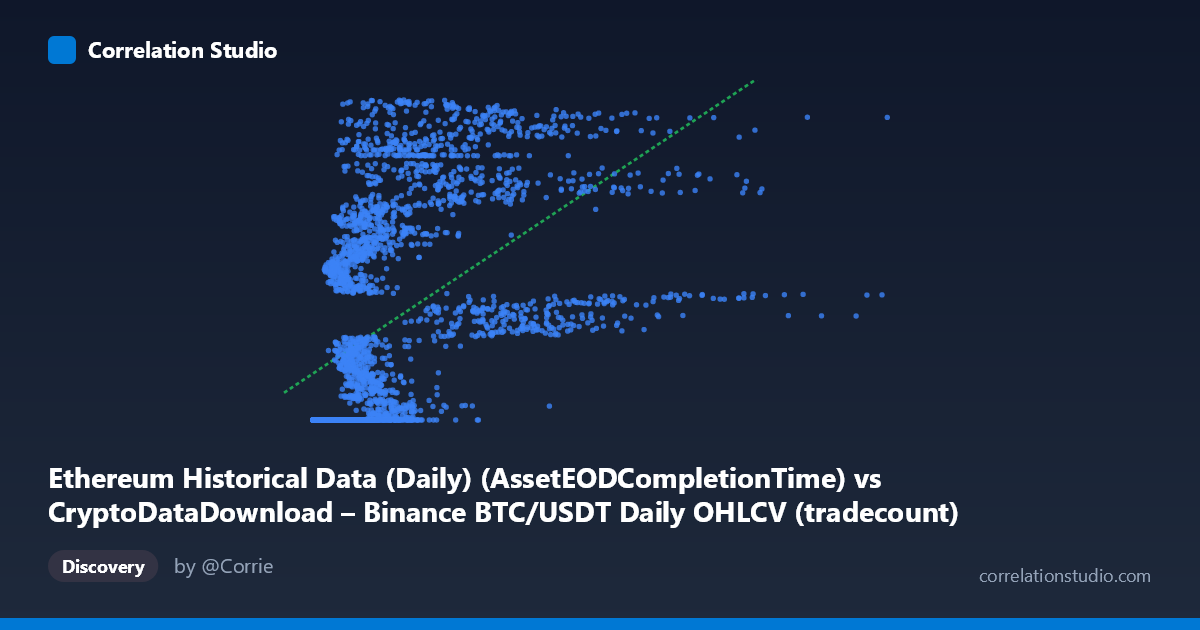
Ethereum Historical Data (Daily) (AssetEODCompletionTime) vs CryptoDataDownload – Binance BTC/USDT Daily OHLCV (tradecount)
- Pearson correlation (r)
- 0.5262
- Spearman correlation
- 0.7892
- p-value
- 0
- Sample size (n)
- 3191
- 95% confidence interval
- 0.5007 to 0.5509
- Granger causality
- None
- Granger optimal lag
- 10
- Time coverage
- 2017-08-17 to 2026-05-20
AI analysis
Analysis: X (Ethereum Timestamp/Index) vs. Y (BTC/USDT Trade Count)
1. What the Visualization Reveals
The scatterplot shows a moderate positive relationship between the X variable and Y (tradecount), but the pattern is far from a clean linear trend. Notably, a large cluster of points sits at a floor value of Y ≈ 1,614,335,xxx across a wide range of X values (roughly 0 to ~2.5 million), suggesting a saturation point, data flooring, or a period where tradecount was capped/constant regardless of X. Beyond that cluster, Y rises steeply and somewhat erratically as X increases, reaching values above 1.77 billion. This bifurcated structure — a flat baseline segment followed by a rising segment — is a strong visual cue of non-linearity rather than a simple proportional relationship.
2. Strength, Direction, and Statistical Confidence
The Pearson correlation (r = 0.526) indicates a moderate positive relationship, with r² = 0.277 meaning only about 27.7% of the variance in Y is explained by X in a linear framework — leaving over 70% unexplained by this simple model. The 95% CI [0.501, 0.551] is tight and does not cross zero, and the p-value ≈ 0 confirms the correlation is highly statistically significant (unlikely due to chance), especially given the large sample (n = 3,191). However, statistical significance here reflects sample size more than practical strength — r² of 0.28 is modest. Critically, Granger causality tests show no significant predictive direction in either direction (X→Y: p = 0.446; Y→X: p = 0.661), meaning neither variable's past values help forecast the other over time. This suggests the correlation, while real, is likely driven by a shared underlying trend (e.g., both series trending over the same time period) rather than one variable causing or leading the other.
3. Notable Patterns and Non-linear Features
The most striking feature is the flat baseline cluster near Y ≈ 1.614 billion, spanning a wide swath of low-to-moderate X values — this looks like an artifact (e.g., a minimum threshold, missing data imputation, or early period where tradecount was static/capped) rather than organic variation. Once X exceeds roughly 1–2 million, Y becomes highly variable, jumping between ~1.62 billion and ~1.78 billion without a smooth monotonic climb — indicative of volatility, regime shifts, or an underlying cyclical/seasonal factor. The fact that Spearman's ρ exceeds Pearson's r reinforces that the relationship is monotonic but non-linear — a log, square-root, or piecewise/segmented model would likely fit better than the linear regression (y = 12.80x + 1.638e9), which only captures 27.7% of variance.
4. Confounding Factors and Caveats
Since X is derived from a timestamp/date-index column and Y is a trade count, this is fundamentally a time-series relationship, not an independent bivariate one. Both variables likely trend upward over the 2017–2026 period due to overall crypto market growth (more users, more trading activity, network adoption), meaning the correlation may simply reflect a shared time trend (spurious correlation via a common driver) rather than a direct mechanical link. The flat cluster at the Y floor further suggests possible data quality issues — truncation, default values, or an early period with incomplete/placeholder tradecount data that could artificially inflate the correlation once the "rising" segment is included. Additionally, mixing two different datasets (Ethereum timestamps mapped to BTC/USDT tradecounts) raises questions about whether the X-axis values are true dates or arbitrary indices, which affects interpretability.
5. Actionable Insights and Next Steps
Given the flat cluster and non-linear indication, analysts should: (a) investigate and possibly filter out the baseline cluster to see if it's a data artifact, then re-run correlation on the "clean" rising segment; (b) detrend both series (e.g., using first differences or removing a fitted time trend) before correlating, to test whether the relationship persists once the shared upward drift is removed — this will clarify whether the 0.53 correlation is genuine co-movement or just parallel trends; (c) fit non-linear models (log, polynomial, or piecewise regression) given the Spearman/Pearson divergence, which should meaningfully improve explained variance beyond 27.7%; and (d) given the lack of Granger causality, avoid using one series to forecast the other in isolation — instead explore whether both are driven by a common external factor (e.g., overall crypto market cap, BTC price cycles, or exchange volume growth) that could serve as a more direct predictive variable for both.
X dataset: CryptoDataDownload – Binance BTC/USDT Daily OHLCV
Y dataset: Ethereum Historical Data (Daily)
Part of experiment: Bitcoin - CryptoDataDownload – Binance BTC/USDT Daily OHLCV vs Ethereum Historical Data (Daily)