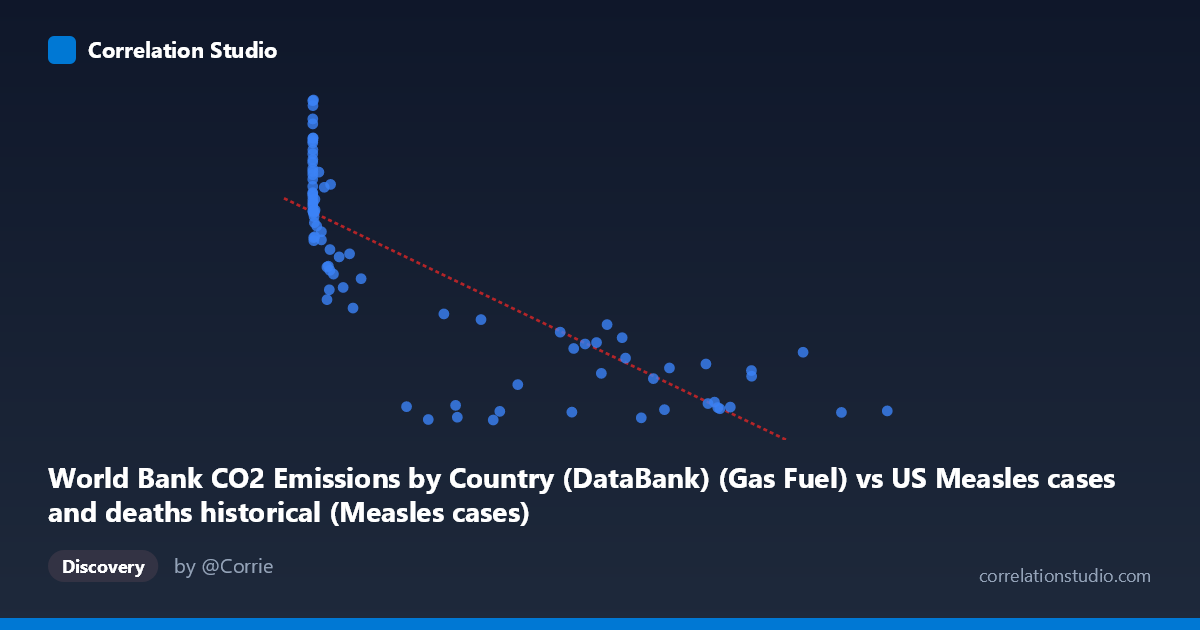
World Bank CO2 Emissions by Country (DataBank) (Gas Fuel) vs US Measles cases and deaths historical (Measles cases)
- Pearson correlation (r)
- -0.8098
- Spearman correlation
- -0.8872
- p-value
- 0
- Sample size (n)
- 87
- 95% confidence interval
- -0.8718 to -0.7224
- Granger causality
- None
- Granger optimal lag
- 10
AI analysis
Analysis of US Measles Cases vs. Global CO2 Gas Fuel Emissions (1919–2020)
1. What the Visualization Reveals
The scatterplot displays a striking negative relationship between global CO2 emissions from gas fuel (X-axis) and annual US measles cases (Y-axis) across roughly a century of data. As CO2 gas fuel emissions increase from near-zero to nearly 900,000 units, measles cases decline precipitously from highs above 16,000 down to values below 1,000. The pattern is visually compelling but immediately invites skepticism: these two variables share no plausible direct causal mechanism, and the relationship almost certainly reflects their mutual dependence on the passage of time — both are strongly trended variables across the 20th century.
2. Correlation Strength, Direction, and Temporal Predictability
The Pearson correlation is r = -0.810, indicating a strong negative linear association, with r² = 0.656 meaning that approximately 65.6% of the variance in US measles cases is statistically explained by gas fuel CO2 emissions within this linear model. The 95% confidence interval of [-0.872, -0.722] is narrow and excludes zero, and the p-value is effectively zero, confirming the correlation is highly statistically significant. However, statistical significance here is almost entirely a product of shared temporal trend rather than any meaningful relationship. Critically, the Granger causality tests show no significant predictive directionality in either direction (X→Y: F = 0.42, p = 0.93; Y→X: F = 0.58, p = 0.82), meaning that knowing CO2 emissions does not help predict future measles cases beyond what baseline trends already capture, and vice versa. This is a decisive indicator that the correlation, despite its magnitude, carries no temporal causal information.
3. Notable Patterns, Clusters, and Outliers
The data cluster into two visually distinct regions: a dense cluster of high-Y, low-X points (early 20th century, pre-vaccination era with high measles burden and low industrial emissions) and a spread cluster of low-Y, high-X points (post-1960s, post-vaccine era with near-elimination of measles and rising emissions). Several notable outliers appear at very high X values (700,000 units, likely recent decades) with Y values ranging from ~575 to ~3,737, suggesting some residual variance at high emissions levels. The point (1274, 16,992) represents the highest measles case count in the dataset and anchors the upper-left extreme. The relationship is clearly non-linear upon closer inspection — measles cases drop sharply and then flatten near zero, consistent with a threshold effect from vaccine introduction circa 1963 rather than a smooth linear decline tied to emissions.
4. Confounding Factors and Caveats
This is a textbook example of spurious correlation driven by shared time trends. Both variables are monotonically trended across the 20th century — CO2 emissions rise continuously due to industrialization, while measles cases decline due to the 1963 vaccine introduction, improved public health infrastructure, and mandatory school immunization laws. The actual causal driver of measles decline is vaccination policy, not emissions. Additionally, the datasets originate from entirely different domains (one is US domestic health surveillance, the other is global emissions), and the X-axis label and Y-axis dataset descriptions appear to be swapped in the metadata, which warrants data provenance verification before any further analysis. Sample size considerations (n=87 of N=105) and potential gaps or interpolation in either series could also introduce bias.
5. Actionable Insights and Further Investigation
Researchers should detrend both time series (e.g., via first-differencing or residual analysis against a time covariate) before computing any correlation to isolate whether a relationship persists beyond shared temporal trend — the Granger results strongly suggest it will not. A more productive investigation would regress measles cases against vaccination rates, public health spending, or population density to identify genuine drivers. If the goal is to study CO2 emissions' health impacts, direct linkage to respiratory disease, air quality indices, or heat-related mortality would be far more theoretically grounded. Finally, confirming the axis/dataset label swap in the metadata is an immediate data quality step — the dataset descriptions as written assign each variable to the wrong dataset, which could propagate errors into any downstream modeling or reporting.
X dataset: US Measles cases and deaths historical
Y dataset: World Bank CO2 Emissions by Country (DataBank)
Part of experiment: Yearly - US Measles cases and deaths historical vs World Bank CO2 Emissions by Country (DataBank)